
Fig. 2
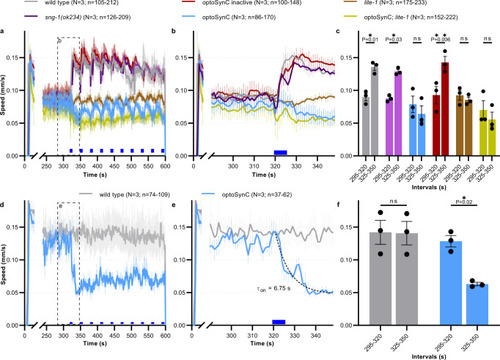
Immediate inhibition of the LITE-1-dependent escape response by optoSynC.
a Mean ± s.e.m crawling speed analysis, blue light application (470 nm, 1 mW/mm², 5 s / 25 s ISI, indicated by blue rectangles), genotypes as indicated (optoSynC expressing animals are in sng-1(ok234) background). b Close-up of box indicated in a. c Group data, mean crawling speed of animals tested in N = 3 independent experiments (±s.e.m), analyzed as mean of time intervals before (295–320 s), and after (325–350 s) first light pulse; number of independent animals (n) across all independent experiments (N, i.e. animals picked from N independent populations) is indicated as range. d As in a, but using only 0.1 mW/mm² stimuli. e Close-up of box indicated in d. Dotted line represents one phase decay fit. f As in c, for data in d. In c, f, data are statistically analyzed with two-way ANOVA, Bonferroni correction, ns not significant. |