
Fig. 8
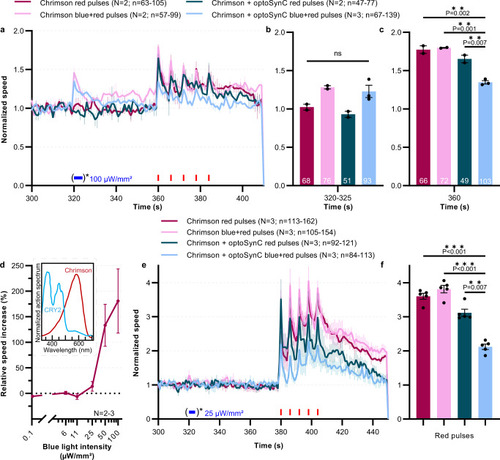
Expression of optoSynC in the single nociceptive neuron PVD attenuates PVD::Chrimson-evoked velocity increase.
a Mean ± s.e.m. normalized crawling speed of animals expressing Chrimson, or Chrimson and optoSynC in the PVD neuron. Red light stimulation (680 nm, 0.1 mW/mm², 1 s/5 s ISI) is indicated by red rectangles, activation of optoSynC with blue light (470 nm, 0.1 mW/mm², 5 s) by a blue rectangle and asterisk. Data acquisition started at 0 s, but animals are left to accommodate before starting the experiment. b Group data, mean crawling speed of N = 2–3 independent experiments (±s.e.m) analyzed during time intervals with (or without) blue pulse (320–325 s). Number of independent animals (n) across all independent experiments (N, i.e. animals picked from N independent populations) is indicated as range. c As in b, but during first red light pulse (360 s). d Light intensity titration of blue light responses of PVD::Chrimson animals (mean ± s.e.m.; 61–147 individual animals, across N = 2–3 independent experiments, were analyzed). Inset: Spectral overlap of CRY2 and Chrimson, derived from refs. 44,81. e As in a, but with only 25 µW/mm² optoSynC activation, avoiding optical crosstalk with Chrimson. f as in c, but during peaks of red pulses (380 s, 386 s, 392 s, 398 s, 404 s), for data in e. In b, c, f: one-way ANOVA with Bonferroni correction; ns non-significant. Number of independent experiments (N) and individual animals (n) is indicated. |