
|
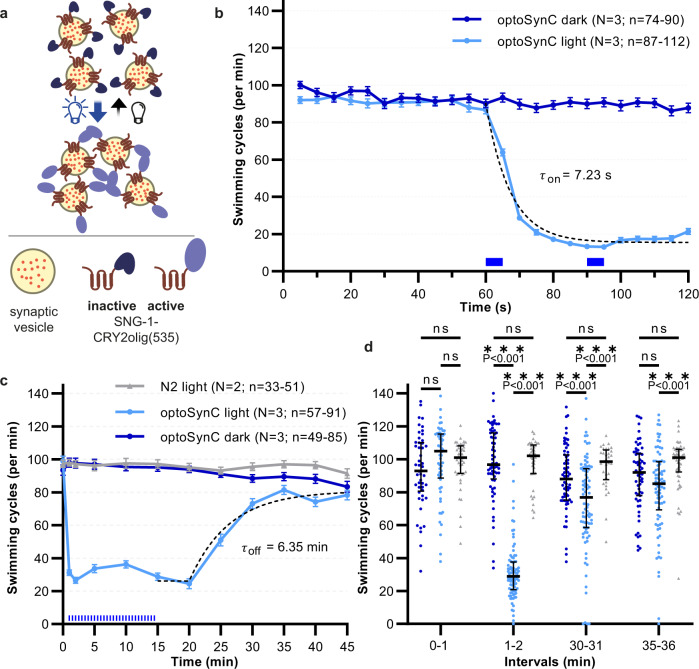
Fig. 1
a Schematic illustrating SV clustering through homo-oligomerization of CRY2olig(535) upon blue light illumination. b Mean (±s.e.m.) swimming cycles of worms expressing optoSynC pan-neuronally. Illumination (470 nm, 0.1 mW/mm², 5 s / 25 s ISI) is indicated by blue rectangles; dotted line: one-phase decay fit (60 –120 s). c As in b, longer time course. Sustained inhibition of swimming by ongoing light pulses, and recovery in the dark. Dotted line: ‘plateau followed by one phase association’-fit. N2 – non-transgenic wild type. d Group data (speed of individual animals, median + inter-quartile range) before (0–1 min), during (1–2 min), and after (30–31; 35–36 min) blue illumination. Two-way ANOVA with Bonferroni correction between light and dark measurements of wild type and optoSynC expressing animals (sng-1(ok234) background); ***p < 0.001; ns – non-significant. Number of individual animals (n) from left to right: 44, 57, 49, 42, 91, 64, 33, 85, 65, 51, 82, 63; across N = 2 (wild type) and N = 3 (optoSynC) independent experiments with animals picked from independent populations; range of individual animals across each measured time point and over N independent experiments is indicated for b and c.