
|
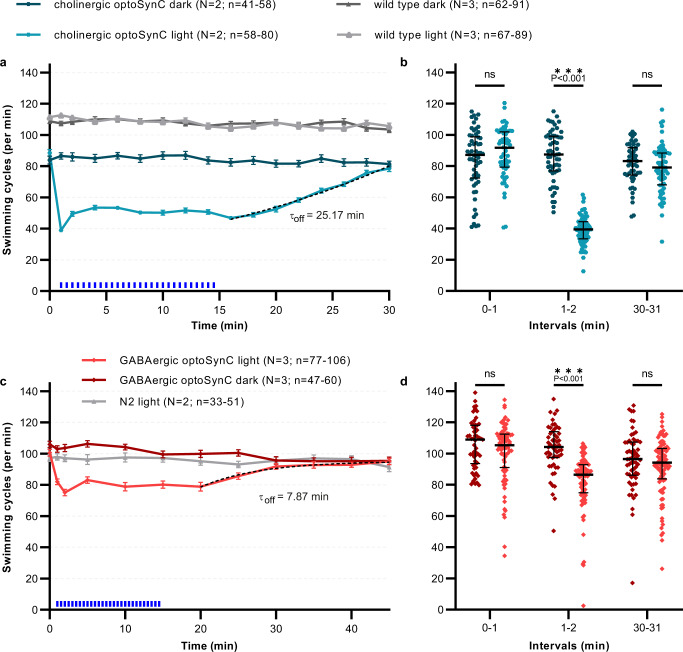
Fig. 7
a Swimming behavior in animals expressing optoSynC in cholinergic neurons. Blue light activation (470 nm, 0.1 mW/mm², 5 s/25 s ISI) indicated by blue rectangles. Dotted line: ‘plateau followed by one phase association’-fit. Error bars are s.e.m. Number of individual animals (n) across independent experiments (N, i.e. animals picked from N independent populations) is indicated as range. b Swimming cycles of individual animals, median and 25–75 % IQR of N = 2–3 experiments analyzed in time intervals before (0–1 min), during (1–2 min), and after (30–31 min) blue light illumination; number of individual animals (n) across all experiments from left to right: 58, 58, 57, 72, 53, 64. Two-way ANOVA with Bonferroni correction between light and dark measurements of wild type and cholinergic optoSynC expressing strains; ***p < 0.001. c, d as for a, b, but optoSynC was expressed in GABAergic neurons. Number of individual animals (n) from left to right: 77, 55, 86, 56, 98, 60.