
- Title
-
Neuromasts and Olfactory Organs of Zebrafish Larvae Represent Possible Sites of SARS-CoV-2 Pseudovirus Host Cell Entry
- Authors
- Choi, S.S.A., Chan, H.H., Chan, C.M., Wang, X., Webb, S.E., Leung, K.W., Tsim, K.W.K., Miller, A.L.
- Source
- Full text @ J. Virol.
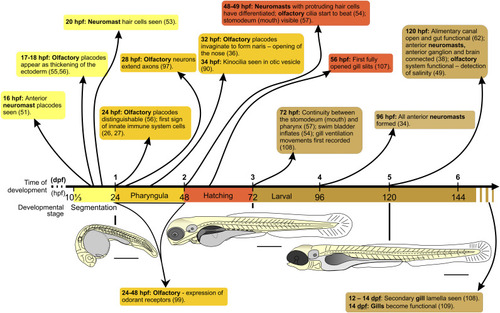
Schematic to show the timing of development of the zebrafish neuroblasts, olfactory organ, stomodeum, digestive tract, swim bladder, and gills from ~10⅓ to ~144 hpf, encompassing the segmentation, pharyngula, hatching, and larval stages. Schematics of zebrafish embryos/larvae at 1, 3, and 5 dpf are shown. Bars, 500 μm. |
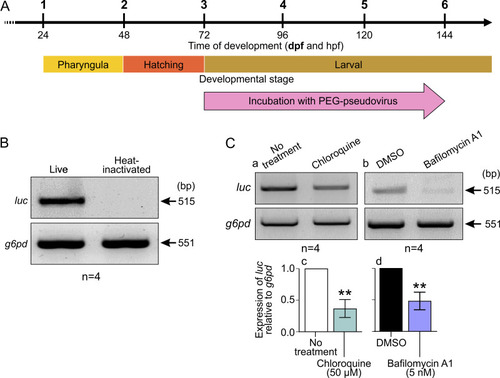
Effect of incubating ABTU wild-type embryos with PEG-pseudovirus at ~3 dpf for 72 h. (A) Schematic to show when embryos were incubated with PEG-pseudovirus. (B) Representative (n = 4) gel electrophoresis image showing RT-PCR results from cDNA extracted from whole ABTU larvae exposed to live or heat-inactivated PEG-pseudovirus. (C) (a and b) Representative gel electrophoresis images and (c and d) bar charts of the RT-PCR results from cDNA extracted from whole ABTU larvae exposed to live PEG-pseudovirus and treated with (a and c) 50 μM chloroquine or (b and d) 50 nM bafilomycin A1 (n = 4 for each). The level of expression of luciferase (luc) mRNA was determined against that of glucose-6-phosphate dehydrogenase (g6pd) mRNA, and the gene expression level following treatment with chloroquine or bafilomycin A1 was measured relative to the respective untreated or DMSO-treated controls. Values are means and standard errors of the means (SEM) from 4 experiments. A 2-sample t test was used to calculate statistical significance. **, P < 0.01. |
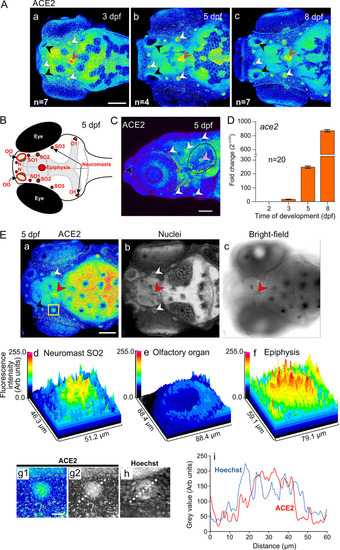
Expression of ace2 mRNA and ACE2 protein in zebrafish embryos and larvae. (A) Localization of ACE2 in the head (viewed from a dorsal orientation) at 3 dpf, 5 dpf and 8 dpf (n = 4 to 7) showing distinct expression in the olfactory organ (black arrowheads), neuromasts (white arrowheads) and epiphysis (brown arrowheads). (B) Schematic showing a dorsal view of the head of a zebrafish larva at 5 dpf indicating the position of the olfactory organs (OO), the nasal (N), supraorbital (SO1 to SO3) and otic (O1) neuromasts, and the epiphysis. (C) Lateral view of the head showing the localization of ACE2 at 5 dpf. Expression in the olfactory organ, neuromasts, and otic vesicle is indicated by black, white, and pink arrowheads, respectively. (D) Expression of ace2 mRNA at 2 dpf, 3 dpf, 5 dpf, and 8 dpf was determined by qRT-PCR. The gene expression levels were quantified using the ΔΔCT method and are presented as fold change (2−ΔΔCT), with β-actin as the internal control, and normalized to the values for the 2-dpf group. (E) Representative (a and b) confocal and (c) bright-field images showing the expression of (a) ACE2 and (b) the nuclei (labeled with Hoechst 33258) in the head of a larva (dorsal view) at 5 dpf. The black, white, and red arrowheads indicate distinct ACE2 labeling in the olfactory organ, neuromasts, and epiphysis, respectively. The region bounded by the yellow square in panel a is shown at higher magnification in panel g1. (d to f) Surface plots showing the fluorescence intensity in neuromast SO2, the olfactory organ, and epiphysis, respectively. (g to i) Line scans were conducted across neuromast SO2 to compare the pattern of expression of ACE2 with respect to the localization of nuclei. The colored image (g1) was converted to greyscale (g2) before a line scan analysis was conducted. (i) Line graphs showing the change in gray value for the expression of ACE2 and localization of nuclei. Bars, 100 μm (A, C, and E [panel a]) and 20 μm (E [g1]). |
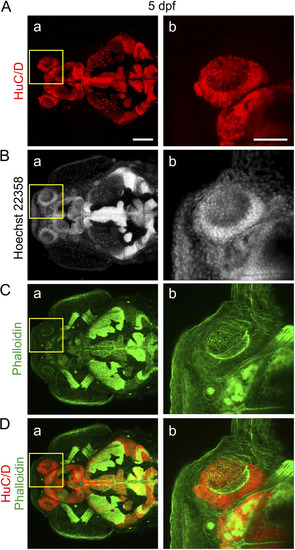
Localization of neurons in the olfactory organ of larvae at 5 dpf. Representative (n = 7) dorsal views of a larva (A) immunolabeled with anti-HuC/D, to label neuronal nuclei, and then stained with (B) Hoechst 33258 and (C) fluorescent phalloidin, to label the nuclei and F-actin, respectively. (D) Merged HuC/D and phalloidin images. The regions bounded by the yellow squares in panels a are shown at higher magnification in panels b. Bars, 100 μm (panels a) and 50 μm (panels b). |
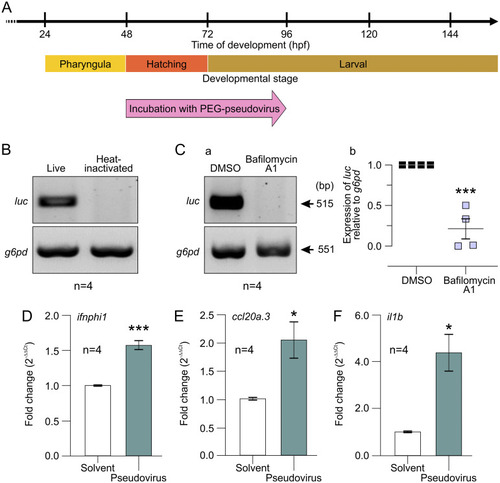
Effect of incubating ABTU wild-type embryos with PEG-pseudovirus at ~2 dpf for 48 h. (A) Schematic to show when embryos were incubated with PEG-pseudovirus. (B) Representative (n = 4) gel electrophoresis image of luc expression from RT-PCR analysis of cDNA extracted from whole embryos exposed to live or heat-inactivated PEG-pseudovirus. (C) (a) Representative (n = 4) gel electrophoresis images showing an RT-PCR analysis of cDNA obtained from whole embryos pretreated with bafilomycin A1 or DMSO (control) prior to exposure to live PEG-pseudovirus. (b) Quantification of the relative expression of luc mRNA in the bafilomycin A1 group, compared to the DMSO group. In both treatment groups, the level of expression of luc was determined against that of g6pd mRNA. (D to F) Immune and inflammatory responses of intact zebrafish larvae upon exposure to live PEG-pseudovirus. RT-qPCR analysis of cDNA obtained from zebrafish larvae exposed to PBS containing PEG-pseudovirus or PBS and PEG alone (solvent control) showing changes in the expression of (D) ifnphi1, (E) ccl20a.3, and (F) il1b. The gene expression levels were quantified using the ΔΔCT method and are presented as fold change (2−ΔΔCT), with β-actin as the internal control and relative to the PBS-PEG solvent control group. For panels Cb and D to F, 2-sample t tests were used to calculate statistical significance. *, P < 0.05; ***, P < 0.001. |
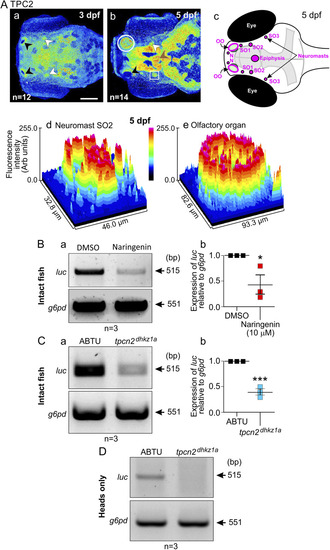
Effect of pharmacologically mediated inhibition of TPC2 activity or CRISPR/Cas9-mediated tpcn2 knockout on PEG-pseudovirus entry in zebrafish larvae. (A) (a and b) Immunolabeling analysis of TPC2 localization in the head at 3 dpf and 5 dpf (viewed from a dorsal orientation) showing distinct expression in the olfactory organ (black arrowheads), neuromasts (white arrowheads), and epiphysis (brown arrowheads). (c) Schematic showing a dorsal view of the head of a zebrafish larva at 5 dpf indicating the position of the olfactory organs (OO), nasal (N) and supraorbital (SO1 to SO3) neuromasts, and epiphysis. (d and e) Surface plots showing the fluorescence intensity in neuromast SO2 and the olfactory organ, respectively. Bar, 100 μm. (B) RT-PCR analysis of cDNA obtained at 2 dpf from intact wild-type embryos that were pretreated with naringenin or DMSO (control) prior to exposure to live PEG-pseudovirus for 48 h. (a) Representative electrophoresis gel showing luc expression and (b) quantification of the relative expression of luc in the naringenin group compared to the DMSO group. (C) RT-PCR analysis of cDNA obtained from intact wild-type and tpcn2dhkz1a embryos, which were exposed to live PEG-pseudovirus at 2 dpf for 48 h. (a) Representative electrophoresis gel showing luc expression and (b) quantification of the relative expression of luc in the tpcn2 mutant compared to the wild-type control. (D) Representative electrophoresis gel of luc expression from RT-PCR analysis of cDNA extracted from the excised heads alone of wild-type and tpcn2dhkz1a embryos that had been exposed to live PEG-pseudovirus at 2 dpf for 48 h. |
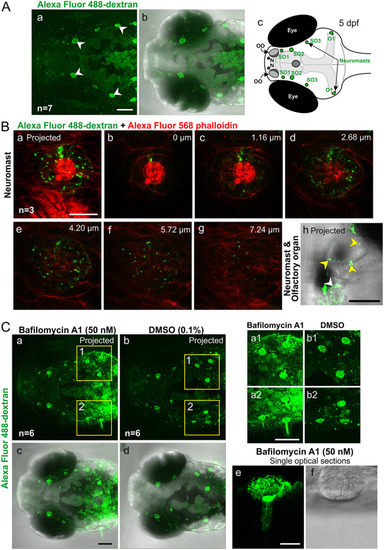
Visualization of endocytosis via the uptake of Alexa Fluor 488-dextran (AF488), in the head of zebrafish larvae at 5 dpf. (A) Representative (n = 7) dorsal views of the head showing (a) fluorescence and (b) fluorescence and bright-field merged images to show the uptake of AF488 in the supraorbital and otic neuromasts (white arrowheads). (c) Schematic showing a dorsal view of the head of a zebrafish larva at 5 dpf indicating the main regions of AF488 uptake (green). (B) Higher-magnification views (n = 3) of AF488 uptake (green) in (a to g) a neuromast, where the F-actin was labeled with Alexa Fluor 568 phalloidin (red), and (h) a neuromast (white arrowhead) and olfactory organ (yellow arrowheads). (C) Effect of bafilomycin A1 on AF488 uptake into the head neuromasts. Embryos were incubated with (a and c) bafilomycin A1 or (b and d) DMSO (controls). Images are representative (n = 6 for each treatment group) (a and b) fluorescence images and (c and d) fluorescence images merged with bright-field images. The regions bounded by the yellow squares in panels a and b are shown at higher magnification in panels a1 to b2. (e and f) Higher-magnification view of an O1 neuromast. All images are stacks of optical sections projected as single images except panels Bb to g and Ce and f, which show single optical sections. Bars, 100 μm (A, Cc, and Ca2), 50 μm (Bh), and 20 μm (Ba and Ce). |
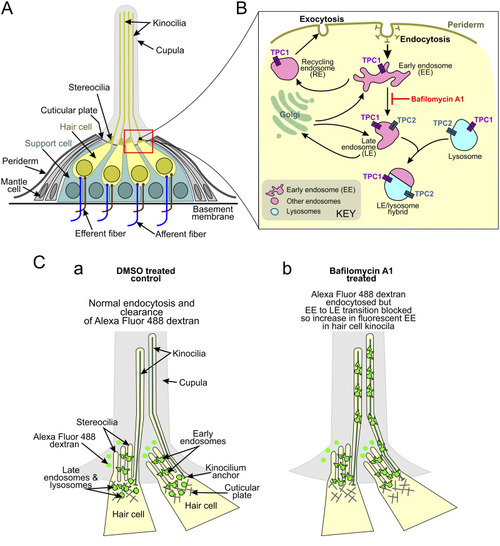
Schematic illustrations to show the suggested mechanism of PEG-pseudovirus entry into the anterior neuromasts of zebrafish larvae. (A) Structure of a neuromast. The regions bounded by the black and red rectangles are shown at higher magnification in panels B and C, respectively. (B) Proposed endocytic pathway illustrating the localization of TPCs (both TPC1 and TPC2) on different endolysosomal compartments and the location of bafilomycin A1 inhibition. (C) Proposed endocytic mechanism in the anterior neuromasts of (a) DMSO-treated (control) and (b) bafilomycin A1-treated larvae, after incubation with Alexa Fluor 488-dextran (green). Panel A was modified from reference 155 with permission of Elsevier, and panel B was modified from reference 156 with permission of the Federation of European Biochemical Societies. |