
FIG 3
- ID
- ZDB-FIG-221226-25
- Publication
- Choi et al., 2022 - Neuromasts and Olfactory Organs of Zebrafish Larvae Represent Possible Sites of SARS-CoV-2 Pseudovirus Host Cell Entry
- Other Figures
- All Figure Page
- Back to All Figure Page
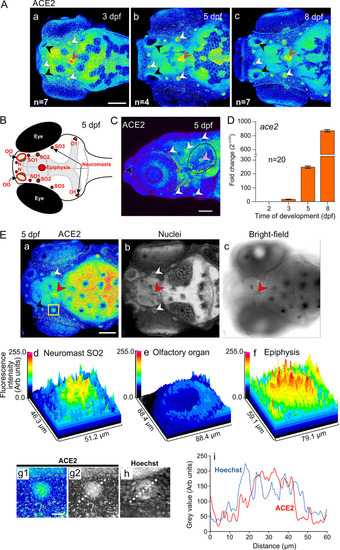
Expression of ace2 mRNA and ACE2 protein in zebrafish embryos and larvae. (A) Localization of ACE2 in the head (viewed from a dorsal orientation) at 3 dpf, 5 dpf and 8 dpf (n = 4 to 7) showing distinct expression in the olfactory organ (black arrowheads), neuromasts (white arrowheads) and epiphysis (brown arrowheads). (B) Schematic showing a dorsal view of the head of a zebrafish larva at 5 dpf indicating the position of the olfactory organs (OO), the nasal (N), supraorbital (SO1 to SO3) and otic (O1) neuromasts, and the epiphysis. (C) Lateral view of the head showing the localization of ACE2 at 5 dpf. Expression in the olfactory organ, neuromasts, and otic vesicle is indicated by black, white, and pink arrowheads, respectively. (D) Expression of ace2 mRNA at 2 dpf, 3 dpf, 5 dpf, and 8 dpf was determined by qRT-PCR. The gene expression levels were quantified using the ΔΔCT method and are presented as fold change (2−ΔΔCT), with β-actin as the internal control, and normalized to the values for the 2-dpf group. (E) Representative (a and b) confocal and (c) bright-field images showing the expression of (a) ACE2 and (b) the nuclei (labeled with Hoechst 33258) in the head of a larva (dorsal view) at 5 dpf. The black, white, and red arrowheads indicate distinct ACE2 labeling in the olfactory organ, neuromasts, and epiphysis, respectively. The region bounded by the yellow square in panel a is shown at higher magnification in panel g1. (d to f) Surface plots showing the fluorescence intensity in neuromast SO2, the olfactory organ, and epiphysis, respectively. (g to i) Line scans were conducted across neuromast SO2 to compare the pattern of expression of ACE2 with respect to the localization of nuclei. The colored image (g1) was converted to greyscale (g2) before a line scan analysis was conducted. (i) Line graphs showing the change in gray value for the expression of ACE2 and localization of nuclei. Bars, 100 μm (A, C, and E [panel a]) and 20 μm (E [g1]). |