
FIG 7
- ID
- ZDB-FIG-221226-29
- Publication
- Choi et al., 2022 - Neuromasts and Olfactory Organs of Zebrafish Larvae Represent Possible Sites of SARS-CoV-2 Pseudovirus Host Cell Entry
- Other Figures
- All Figure Page
- Back to All Figure Page
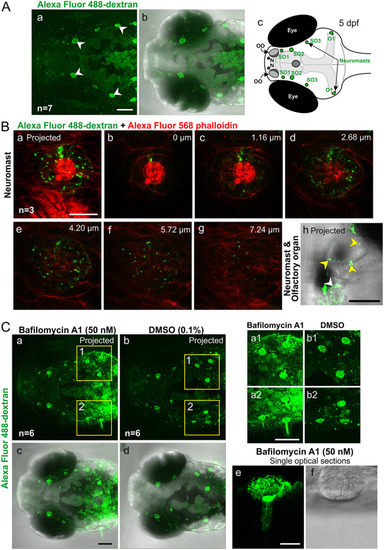
Visualization of endocytosis via the uptake of Alexa Fluor 488-dextran (AF488), in the head of zebrafish larvae at 5 dpf. (A) Representative (n = 7) dorsal views of the head showing (a) fluorescence and (b) fluorescence and bright-field merged images to show the uptake of AF488 in the supraorbital and otic neuromasts (white arrowheads). (c) Schematic showing a dorsal view of the head of a zebrafish larva at 5 dpf indicating the main regions of AF488 uptake (green). (B) Higher-magnification views (n = 3) of AF488 uptake (green) in (a to g) a neuromast, where the F-actin was labeled with Alexa Fluor 568 phalloidin (red), and (h) a neuromast (white arrowhead) and olfactory organ (yellow arrowheads). (C) Effect of bafilomycin A1 on AF488 uptake into the head neuromasts. Embryos were incubated with (a and c) bafilomycin A1 or (b and d) DMSO (controls). Images are representative (n = 6 for each treatment group) (a and b) fluorescence images and (c and d) fluorescence images merged with bright-field images. The regions bounded by the yellow squares in panels a and b are shown at higher magnification in panels a1 to b2. (e and f) Higher-magnification view of an O1 neuromast. All images are stacks of optical sections projected as single images except panels Bb to g and Ce and f, which show single optical sections. Bars, 100 μm (A, Cc, and Ca2), 50 μm (Bh), and 20 μm (Ba and Ce). |