
|
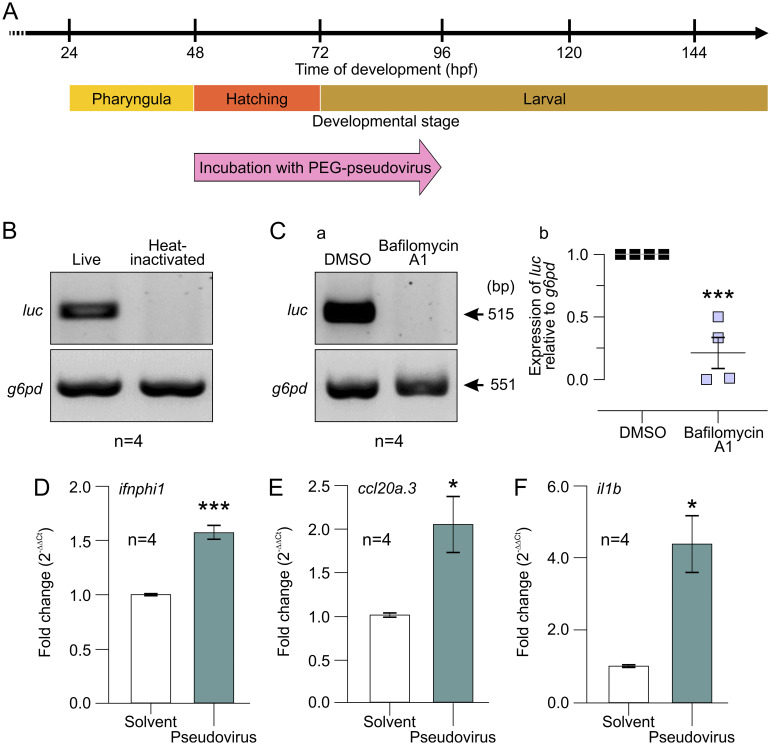
FIG 5 Effect of incubating ABTU wild-type embryos with PEG-pseudovirus at ~2 dpf for 48 h. (A) Schematic to show when embryos were incubated with PEG-pseudovirus. (B) Representative (n = 4) gel electrophoresis image of luc expression from RT-PCR analysis of cDNA extracted from whole embryos exposed to live or heat-inactivated PEG-pseudovirus. (C) (a) Representative (n = 4) gel electrophoresis images showing an RT-PCR analysis of cDNA obtained from whole embryos pretreated with bafilomycin A1 or DMSO (control) prior to exposure to live PEG-pseudovirus. (b) Quantification of the relative expression of luc mRNA in the bafilomycin A1 group, compared to the DMSO group. In both treatment groups, the level of expression of luc was determined against that of g6pd mRNA. (D to F) Immune and inflammatory responses of intact zebrafish larvae upon exposure to live PEG-pseudovirus. RT-qPCR analysis of cDNA obtained from zebrafish larvae exposed to PBS containing PEG-pseudovirus or PBS and PEG alone (solvent control) showing changes in the expression of (D) ifnphi1, (E) ccl20a.3, and (F) il1b. The gene expression levels were quantified using the ΔΔCT method and are presented as fold change (2−ΔΔCT), with β-actin as the internal control and relative to the PBS-PEG solvent control group. For panels Cb and D to F, 2-sample t tests were used to calculate statistical significance. *, P < 0.05; ***, P < 0.001.