
- Title
-
Mutation of foxl1 Results in Reduced Cartilage Markers in a Zebrafish Model of Otosclerosis
- Authors
- Hawkey-Noble, A., Pater, J.A., Kollipara, R., Fitzgerald, M., Maekawa, A.S., Kovacs, C.S., Young, T.L., French, C.R.
- Source
- Full text @ Genes (Basel)
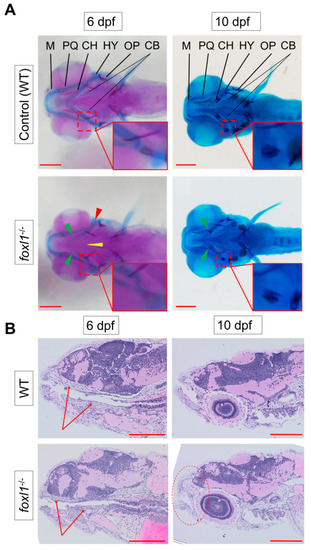
Reduction in cartilage in |
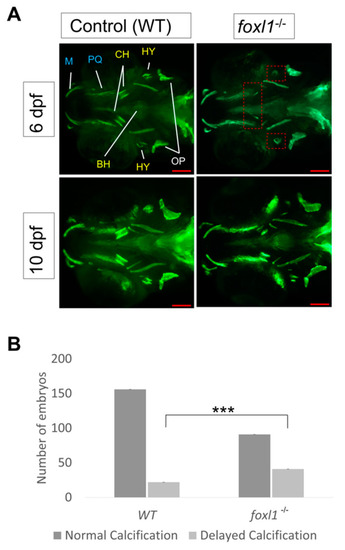
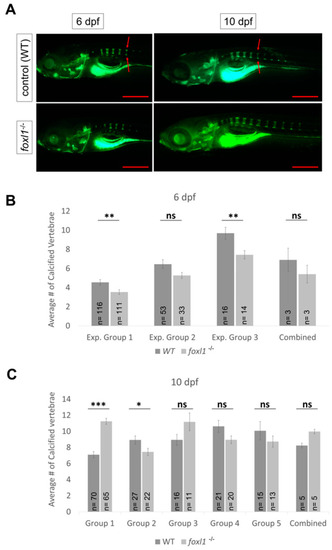
Calcein staining illustrating the impact of |

Expression of |
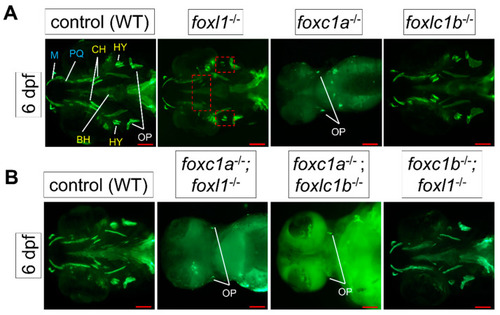
Calcein staining illustrating the impact of PHENOTYPE:
|
Calcein staining illustrating the impact of |
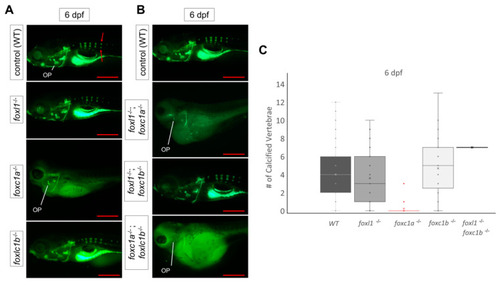
Calcein staining illustrating the impact of PHENOTYPE:
|
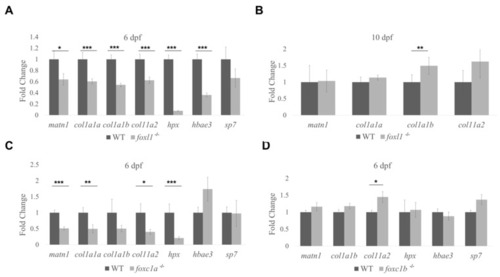
Differential gene expression in forkhead mutants. |