IMAGE

Figure 4

ID
ZDB-IMAGE-220801-140
Source
Figures for Hawkey-Noble et al., 2022
Image
Figure Caption

Figure 4

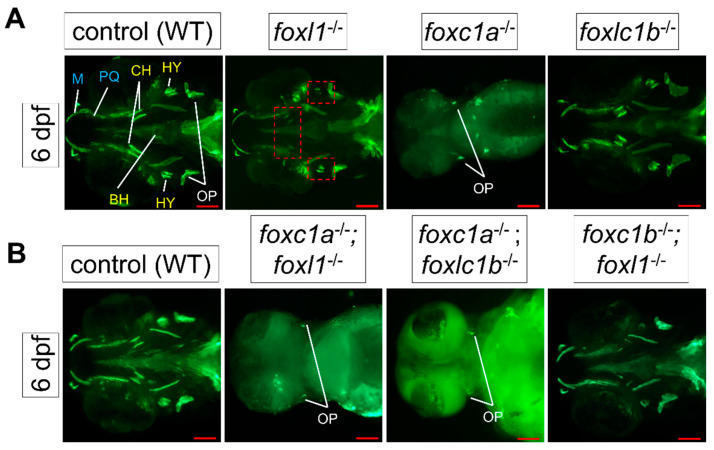
Calcein staining illustrating the impact of foxl1, foxc1a, and foxc1b lone and combined loss on craniofacial development and calcification. (A) foxc1a-/- embryos have a lack of bone development in all craniofacial bones resulting from the first (blue) and second (yellow) pharyngeal arches and diminished formation of the opercula bones at 6 dpf. foxc1b-/- embryos exhibit no change. foxl1 panels are included for reference. (B) WT (n = 173); foxc1a-/-; foxl1-/- (n = 6); foxc1b-/-; foxl1-/- (n = 2); and foxc1a-/-; foxc1b-/- (n = 4) embryos at 6 dpf. foxc1a-/-; foxl1-/- embryos exhibit a further loss of craniofacial bone formation and calcification with increased size in the cardiac edema present, while foxc1b-/-; foxl1-/- embryos exhibit no change from their respective individual knockout models. foxc1a-/-; foxc1b-/- double mutants show a similar phenotype as foxc1a-/-; foxl1-/- embryos. Red boxes highlight areas of interest. Small red squares highlight the hyomandibula and the large rectangular box isolates the ceratohyal bone. Scale bars are 100 µm.

Figure Data
Acknowledgments
This image is the copyrighted work of the attributed author or publisher, and ZFIN has permission only to display this image to its users. Additional permissions should be obtained from the applicable author or publisher of the image. Full text @ Genes (Basel)