FIGURE

Figure 6

ID
ZDB-FIG-220801-140
Publication
Hawkey-Noble et al., 2022 - Mutation of foxl1 Results in Reduced Cartilage Markers in a Zebrafish Model of Otosclerosis
Other Figures
All Figure Page
Back to All Figure Page
Figure 6

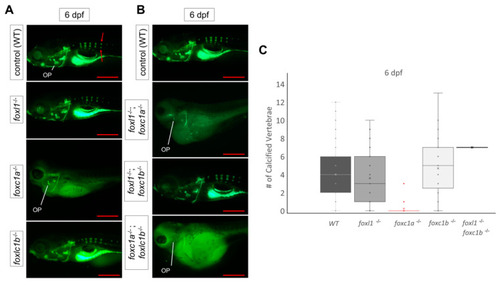
Calcein staining illustrating the impact of foxl1, foxc1a, and foxc1b lone and combined loss on axial skeleton development and calcification. (A) WT, foxl1-/-, foxc1a-/-, and foxc1b-/- embryos at 6 dpf showing normal formation of the vertebrae in foxl1 and foxc1b mutants. foxc1a-/- embryos did not develop or calcify vertebrae and had large abdomen cavity edemas that grew over time. (B) WT; foxc1a-/-; foxl1-/-, foxc1b-/-; foxl1-/-, and foxc1a-/-; foxc1b-/- embryos at 6 dpf. Double foxc1a-/-; foxl1-/- embryos exhibit larger edemas and a lack of most calcified structures at 6 dpf, including the operculum (OP). foxc1b-/-; foxl1-/- embryos had no significant change. foxc1a-/-; foxc1b-/- mutants elicited similar results as foxc1a-/-; foxl1-/- embryos, including edemas and lack of craniofacial calcification. (C) Boxplots illustrating the variability in the number of vertebrae calcified in foxl1-/-, foxc1a-/-, foxc1b-/-,and foxl1-/-; foxc1b-/- mutants in comparison with WT embryos at 6 dpf. Red arrows indicate primary centres of ossification within the vertebrae. Scale bars are 500 µm.

Expression Data

Expression Detail
Antibody Labeling
Phenotype Data
Fish:
Observed In:
Stage: Day 6

Phenotype Detail
Acknowledgments
This image is the copyrighted work of the attributed author or publisher, and ZFIN has permission only to display this image to its users. Additional permissions should be obtained from the applicable author or publisher of the image. Full text @ Genes (Basel)