
- Title
-
Transforming growth factor-beta signaling modulates perineurial glial bridging following peripheral spinal motor nerve injury in zebrafish
- Authors
- Arena, K.A., Zhu, Y., Kucenas, S.
- Source
- Full text @ Glia

Perineurial glia form a bridge and phagocytose debris after spinal motor nerve injury. (a) (Left) Diagrammatic representation of a 6 dpf zebrafish larva with a single peripheral spinal motor nerve (inset) displayed. Motor axon (magenta), ensheathed Schwann cells (orange), perineurial glia (green). (Right) Representative images of an in vivo 6 dpf spinal motor nerve, where olig2 labels motor axons (magenta) and nkx2.2a labels perineurial glia (green). (b–f) n = 11 nerves in 5 larvae. (b) Representative stills taken from time-lapse movies of perineurial glia (green) and motor axons (magenta) in 5 or 6 dpf larvae injured on either the caudal or rostral side of the spinal motor nerve. Stills are shown in the first 6 h post injury (hpi). The dashed circle indicates the injury site. Blue arrows denote phagocytic vesicles in perineurial glia. White arrows follow the proximal end and yellow arrows follow the distal end of the perineurial glial bridge. (c) Quantification of perineurial glial (PG) bridging timing. Timing of bridging initiation (green) and completion (magenta) was recorded in minutes post injury. (d) Quantification of perineurial glial (PG) bridging duration in minutes (mean: 150.54 ± 18.25 min). (e) Quantification of the type of perineurial glial (PG) bridging observed. Proximal and distal bridging (45% of nerves, gray) or proximal only bridging (55% of nerves, black). (f) Quantification of perineurial glial (PG) phagocytosis after injury. Phagocytic vesicles on both proximal and distal perineurial glial stumps (27% of nerves, gray) or only on proximal perineurial glial stumps (73% of nerves, black). (g) Representative timeline of the first 48 h following spinal motor nerve injury in 5 to 6 dpf zebrafish. Motor axon (magenta), Schwann cells (orange), perineurial glia (green), macrophages (blue). Scale bars, 25 μm.
|
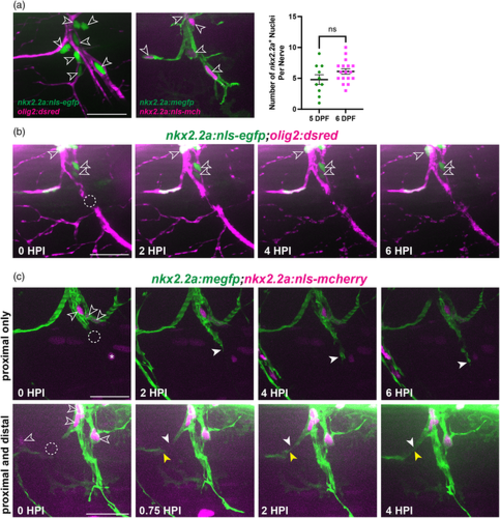
Perineurial glia do not proliferate following spinal motor nerve injury. (a) (Left) Representative images of perineurial glial nuclei (open arrows) imaged with either motor axons (magenta, left) or perineurial glial membrane (green, right) at 5 dpf. (Right) Quantification of the number of nkx2.2a+ nuclei on a single spinal motor nerve in 5 (green, n = 10 nerves in 5 larvae, mean: 4.8 ± 0.79 nuclei) and 6 dpf (magenta, n = 17 nerves in 5 larvae, mean: 6.1 ± 0.44 nuclei) larvae (p = .1272). (b) Representative images from a time-lapse movie of nkx2.2a+ nuclei (green) in an injured 6 dpf larva. The dashed circle indicates the injury site (n = 4 nerves in 3 larvae). (c) Representative still images from a time-lapse movie of nkx2.2a+ nuclei (magenta, open arrowheads) in injured 5 to 6 dpf larvae exhibiting either proximal only bridging (top panels, n = 6 nerves in 4 larvae) or proximal and distal bridging (bottom panels, n = 4 nerves in 3 larvae). Solid white arrows follow the proximal end and yellow arrows follow the distal end of the perineurial glial bridge (green). Asterisks indicate nkx2.2a+ cells that are not perineurial glial nuclei. Scale bars, 25 μm.
|
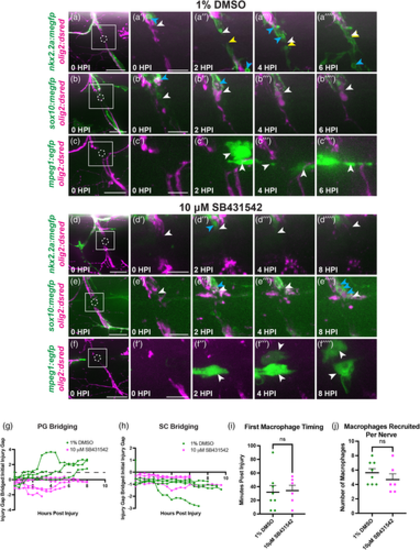
Inhibition of TGFβ signaling perturbs perineurial glial bridging. (a–f) Representative stills from time-lapse movies of 5–6 dpf larvae with injured spinal motor nerves (magenta) treated with either 1% DMSO (a–c) or 10 μM SB431542 (d–f). The dashed circle indicates the injury site while the solid line box indicates the regions of interest highlighted in adjacent insets. Blue arrows specify phagocytic vesicles. (a,d) White arrows follow the proximal end and yellow arrows follow the distal end of the perineurial glial bridge (green). (b,e) White arrows follow the proximal Schwann cell stump (green). (c,f) White arrows show macrophages (green) present in the injury site. (g,h) Quantification of either perineurial glial (PG) bridging (g) or Schwann cell (SC) bridging (h) over 8 hpi in both DMSO (green) and SB431542-treated (magenta) groups. Measurements of perineurial glial membrane (g) or Schwann cell (h) extension into the injury site were compared to the size of the initial injury gap, with values over 1 (dotted-line) indicating complete bridging and values less than zero indicating retraction away from the injury site. (g) All DMSO-treated larvae (n = 5 nerves in 4 larvae) demonstrated complete bridging while perineurial glia in all SB432542-treated larvae (n = 6 nerves in 4 larvae) failed to bridge the injury gap. (h) Schwann cells in both DMSO (n = 4 nerves in 3 larvae) and SB431542-treated larvae (n = 4 nerves in 3 larvae) did not bridge across the injury site. (i) Quantification of the timing of the first macrophage to enter the injury site in both DMSO (green, n = 8 nerves in 5 larvae; mean: 31.88 ± 0 min) and SB431542-treated (magenta, n = 6 nerves in 4 larvae; mean: 34.175.62 ± 0 min) larvae (p = .3335). (j) Quantification of the number of macrophages per nerve recruited to the injury site over 8 hpi in both DMSO (green, n = 8 nerves in 5 larvae; mean: 5.62 ± 0 macrophages) and SB431542-treated (magenta, n = 6 nerves in 4 larvae; mean: 4.67 ± 0 macrophages) larvae (p = .8655). Scale bar, (a–f) 25 μm; (a'–f″) magnified insets, 10 μm.
|
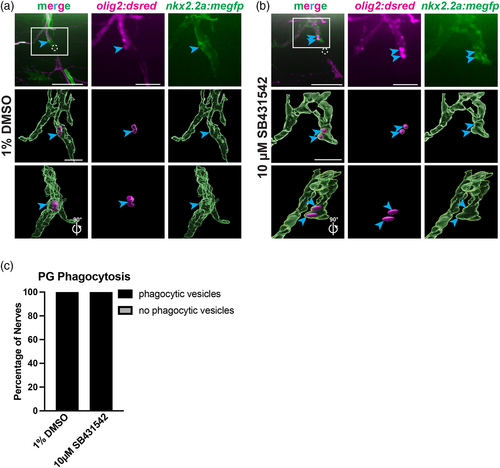
Phagocytosis is observed in perineurial glia with inhibition of TGFβ. (a,b) Representative images of 5 dpf nkx2.2a:megfp;olig2:dsred injured larvae treated with either 1% DMSO (a) or 10 μM SB431542 (b) at 3 hpi. The dashed circle indicates the injury site. Axonal debris and perineurial glial vesicles are specified by blue arrows. 3D renderings of these representative images are shown in both a 0° and 90° rotated views (Imaris). (c) Quantification of the presence of phagocytic vesicles in 1% DMSO or 10 μM SB431542 in 1% DMSO-treated larvae. Phagocytic vesicles were present in 100% of injured nerves in both groups (n = 5 nerves in 4 larvae, 6 nerves in 4 larvae, respectively). Scale bars, 25 μm; magnified insets and 3D renderings, 10 μm.
|
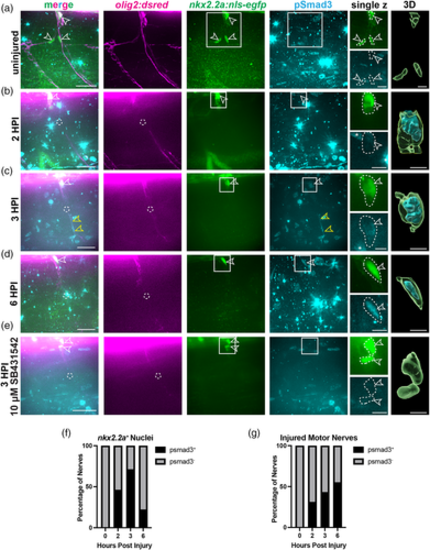
pSmad3 expression is present in perineurial glia early after injury. (a–e) Representative images of 5 or 6 dpf larvae with motor axons (magenta), nkx2.2a+ nuclei (green, white open arrows), and anti-pSmad3 (cyan) in uninjured (a), 2 (b), 3 (c), 6 (d) hpi larvae, and larvae treated with SB431542 at 3 hpi (e). Anti-pSmad3 labeling is observed in nkx2.2a+ nuclei (open white arrows) and along the motor nerve (open yellow arrows) at 2, 3, and 6 hpi. 6 dpf larvae treated with 10 μM SB431542 show loss of anti-pSmad3 staining at 3 hpi (bottom panels). Dashed circles indicate injury sites. Solid-line boxes indicate the area represented in enhanced single z planes and nuclei in 3D rendered images (Imaris). White dotted-lines outline nkx2.2a+ nuclei and anti-pSmad3 labeling. (f,g) Quantification of the percentage of nerves that had anti-pSmad3+ labeling (black) co-localized with nkx2.2a+ nuclei (f) or motor nerves (g). Chi-square tests were performed to determine significance. (f) 0% of uninjured nerves, 46% of 2 hpi nerves, 71% of 3 hpi nerves, and 22% of 6 hpi nerves had anti-pSmad3+ labeling in nkx2.2a+ nuclei (n = 13 nerves in 9 larvae, 20 nerves in 4 larvae, 21 nerves in 6 larvae, 17 nerves in 4 larvae, respectively) (Chi-square: 137.7, df: 3, p < .0001). (g) 0% of uninjured nerves, 31% of 2 hpi nerves, 43% of 3 hpi nerves, and 55% of 6 hpi had anti-pSmad3+ labeling along the nerve (n = 13 nerves in 9 larvae, 20 nerves in 4 larvae, 21 nerves in 6 larvae, 17 nerves in 4 larvae, respectively) (Chi-square: 63.92, df: 3, p < .0001). Scale bars, 25 μm; magnified insets, 10 μm; 3D renderings, 5 μm.
|
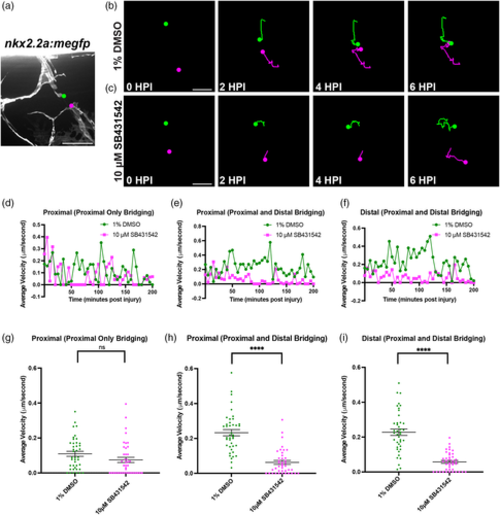
Inhibition of TGFβ signaling alters perineurial glial bridging dynamics. (a) Representative image of a recently transected spinal motor nerve in a 6 dpf nkx2.2a:megfp larva with the proximal (green dot) and distal (magenta dot) stumps labeled. (b,c) Representative images from tracking of both the proximal (green dot) and distal (magenta dot) stumps from time-lapse movies of perineurial glia in injured 5 or 6 dpf larvae treated with either 1% DMSO (b) or 10 μM SB431542 (c). (d–i) Quantification of the average velocity of perineurial glial membrane proximal or distal stumps in μm/s plotted over time (d–f) or for the first 200 min post injury (mpi) (g–i). Velocities were calculated every 5 min using FIJI. Each dot represents the average velocity of all larvae within a group at that specific time point. (d,g) There is no significant difference in proximal only perineurial glial bridging velocity between DMSO and SB431542-treated larvae (mean: 0.116 ± 0.02 μm/s, 0.063 ± 0.015 μm/s, respectively; p = .1078) (n = 3 nerves in 3 larvae, n = 3 nerves in 3 larvae, respectively). (e,f,h,i) There is a significant difference in perineurial glial bridging velocity between DMSO and SB432542-treated larvae, with DMSO-treated larvae having a higher average velocity, (n = 4 nerves in 3 larvae, n = 3 nerves in 3 larvae, respectively) in both proximal (mean: 0.139 ± 0.03, 0.08 ± 0.02 μm/s, respectively; p < .0001) and proximal and distal (mean: 0.18 ± 0.03, 0.06 ± 0.02 μm/s; p < .0001) bridging in larvae that had bridging from both the proximal and distal perineurial glial ends. Scale bars, (a) 25 μm; (b,c) tracking images, 10 μm.
|
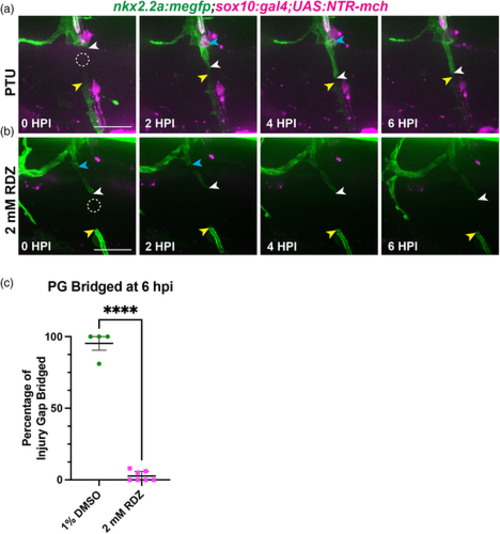
Elimination of Schwann cells immediately prior to injury perturbs perineurial glial bridging. (a,b) Representative images from stills of time-lapse movies of injured 5 or 6 dpf nkx2.2a:megfp;sox10:gal4;UAS:NTR-mch larvae. Dashed circles indicate injury sites. White arrows follow the proximal end and yellow arrows follow the distal end of the perineurial glial bridge (green). Blue arrows indicate phagocytic vesicles. Larvae were treated with either (a) PTU egg water (n = 4 nerves in 3 larvae) or (b) 2 mM ronidazole (RDZ) in PTU egg water (n = 7 nerves in 5 larvae). (c) Quantification of the percentage of the injury gap bridged by perineurial glia (PG) at 6 hpi in larvae treated with either PTU water (green, n = 4 nerves in 3 larvae; mean: 95.25 ± 1.32) or 2 mM RDZ (magenta, n = 7 nerves in 5 larvae; mean: 2.71 ± 1.32) (p < .0001;). Scale bar, 25 μm.
|
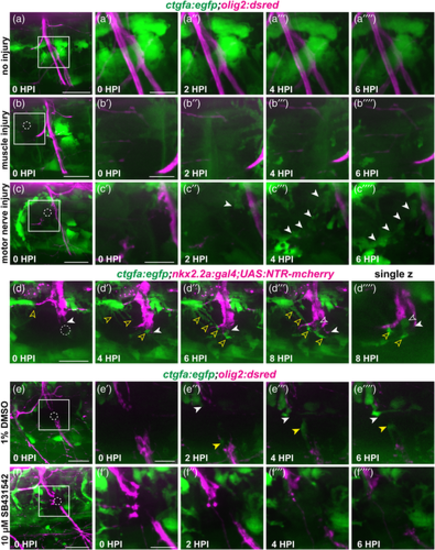
ctgfa expression increases at the injury site. (a–c) Representative images from stills of time-lapse movies of 5 or 6 dpf ctgfa:egfp;olig2:dsred larvae. Larvae were either uninjured (a; n = 4 nerves in 4 larvae), injured in muscle adjacent to spinal motor nerves (b; n = 4 nerves in 4 larvae), or injured along the spinal motor nerve (c; n = 11 nerves in 5 larvae) and time-lapse imaged for 6 hpi. Dashed circles indicate the injury site. White arrows indicate increased ctgfa expression. (d) Representative images from stills of a time-lapse movie of a 6 dpf nkx2.2a:gal4;UAS:NTR-mcherry;ctgfa:egfp larva (n = 6 nerves in 4 larvae). A single z-plane image demonstrates potential regions of co-localization of perineurial glia (magenta) and ctgfa expression (green) at 8 hpi. Solid white arrows follow bridging perineurial glia across the injury site. Open white arrows indicate ctgfa expression that might co-localize with perineurial glia. Open yellow arrows specify increased ctgfa expression that does not co-localize with perineurial glia. (e,f) Representative images from stills of time-lapse movies of 5 or 6 dpf ctgfa:egfp;olig2:dsred larvae. Larvae were either treated with 1% DMSO (E; n = 4 nerves in 3 larvae) or 10 μM SB431542 (F; n = 4 nerves in 3 larvae). White arrows follow the increase in ctgfa expression proximal to the injury site and yellow arrows follow the increase in ctgfa distal to the injury site. Scale bars, 25 μm; magnified insets, 10 μm.
|
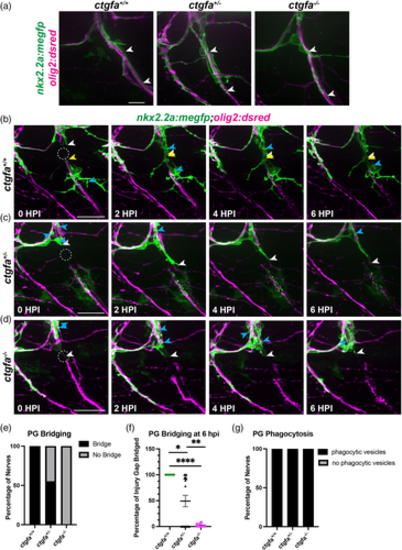
Perineurial glial bridging is perturbed in ctgfa mutants. (a) Representative images prior to injury of 5 dpf ctgfa+/+, ctgfa+/−, and ctgfa−/− nkx2.2a:megfp;olig2:dsred larvae. White arrows indicate healthy perineurial glia fully ensheathing motor nerves. (b–d) 5 or 6 dpf larvae with ctgfa+/+ (n = 5 nerves in 4 larvae), ctgfa+/− (n = 19 nerves in 10 larvae), or ctgfa−/− (n = 11 nerves in 6 larvae) genotypes. (b–d) Representative images from time-lapse movies of 5 or 6 dpf ctgfa+/+ (b), ctgfa+/− (c), or ctgfa−/− (d) larvae where spinal motor nerves were injured. Dashed circles indicate injury site. White arrows follow the proximal end and yellow arrows follow the distal end of the perineurial glial bridge. Blue arrows specify perineurial glial phagocytic vesicles. (e) Quantification of percentage of nerves in which perineurial glia bridged (black) or did not bridge (gray) across ctgfa+/+, ctgfa+/−, or ctgfa−/− genotypes. (f) Quantification of the percentage of the injury gap bridged by perineurial glia at 6 hpi by ctgfa+/+, ctgfa+/−, or ctgfa−/− larvae (mean ± SEM: ctgfa+/+: 100 ± 0; ctgfa+/−: 49.21 ± 11.06; ctgfa−/−: 2.18 ± 0.96. p values: ctgfa+/+ vs. ctgfa+/−: p = .0301; ctgfa+/+ vs. ctgfa−/−: p < .0001; ctgfa+/− vs. ctgfa−/−: p = .0033). (g) Quantification of presence of phagocytic vesicles in ctgfa+/+, ctgfa+/−, or ctgfa−/− larvae. Phagocytic vesicles were present in 100% of larvae across all genotypes. Scale bars, (a) pre-injury images, 10 μm; (b–d) 25 μm.
|
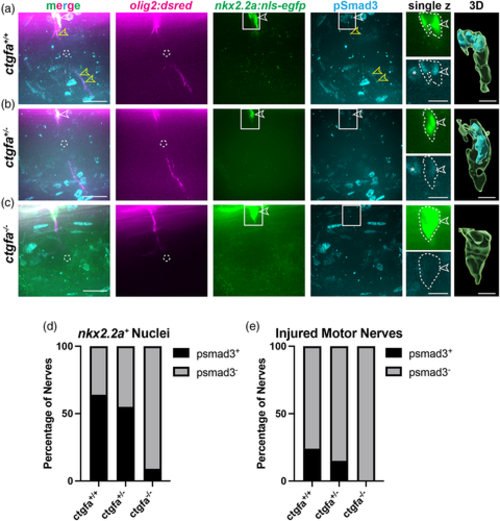
pSmad3 expression is absent in nkx2.2a+ nuclei in ctgfa mutants. (a–c) Representative images of 5 or 6 dpf larvae with motor axons (magenta), nkx2.2a+ nuclei (green), and anti-pSmad3 (cyan) in ctgfa+/+ (a), ctgfa+/− (b), and ctgfa−/− (c) larvae at 3 hpi. Anti-pSmad3 labeling is observed in nkx2.2a+ nuclei (open white arrows) and along the motor nerve (open yellow arrows) in ctgfa+/+ and some ctgfa+/− larvae. ctgfa−/− larvae show loss of anti-pSmad3 staining in nkx2.2a+ nuclei at 3 hpi. Dashed circles indicate injury sites. Solid-line boxes indicate the area represented in enhanced single z planes and nuclei in 3D rendered images (Imaris). White dotted-lines outline nkx2.2a+ nuclei and anti-pSmad3 labeling. (d,e) Quantification of the percentage of nerves that had anti-pSmad3+ labeling (black) co-localized with nkx2.2a+ nuclei (d) or motor nerves (e). Chi-square tests were performed to determine significance (ctgfa+/+: n = 52 nerves in 10 larvae, ctgfa+/−: n = 20 nerves in 7 larvae, ctgfa−/−: n = 23 nerves in 6 larvae). (d) 64% of ctgfa+/+ nerves, 55% of ctgfa+/− nerves, and 9% of ctgfa−/− nerves had anti-pSmad3+ labeling in nkx2.2a+ nuclei (Chi-square: 71.16, df: 2, p < .0001). (e) 24% of ctgfa+/+ nerves, 15% of ctgfa+/− nerves, and 0% of ctgfa−/− nerves had anti-pSmad3+ labeling in nkx2.2a+ nuclei (Chi-square: 25.99, df: 2, p < .0001). Scale bars, 25 μm; magnified insets, 10 μm; 3D renderings, 5 μm.
|
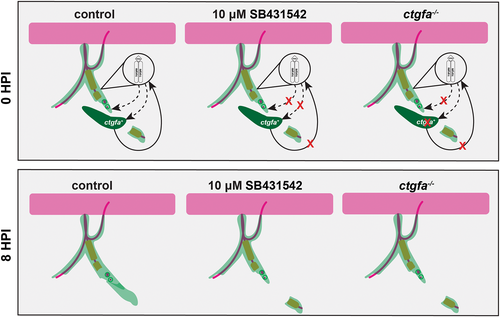
Perineurial glial bridging is modulated by a positive feedback loop between TGFβ signaling and ctgfa. Summary diagram of our proposed signaling model that drives perineurial glial bridging after injury in control, 10 μM SB431542, and ctgfa−/− conditions at 0 (top panels) and 8 hpi (bottom panels). Motor axons (magenta), Schwann cells (orange), perineurial glia (light green), ctgfa expressing cells (dark green). The magnified region designates perineurial glial-specific TGFβ signaling. Dotted-lines indicate TGFβ signaling whereas solid lines indicate ctgfa signaling. Red “X”s demonstrate pathways that are inhibited or turned off in either 10 μM SB431542 treatment or ctgfa−/− larvae.
|