
Image
|
Figure Caption
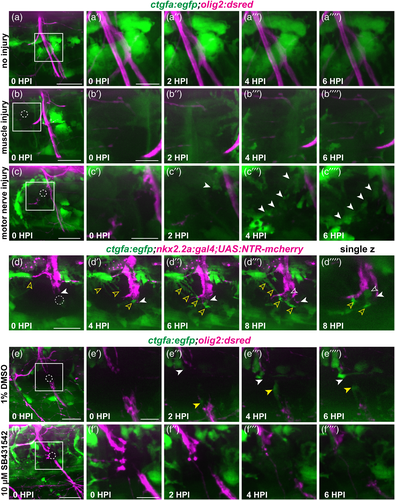
Fig. 8
ctgfa expression increases at the injury site. (a–c) Representative images from stills of time-lapse movies of 5 or 6 dpf ctgfa:egfp;olig2:dsred larvae. Larvae were either uninjured (a; n = 4 nerves in 4 larvae), injured in muscle adjacent to spinal motor nerves (b; n = 4 nerves in 4 larvae), or injured along the spinal motor nerve (c; n = 11 nerves in 5 larvae) and time-lapse imaged for 6 hpi. Dashed circles indicate the injury site. White arrows indicate increased ctgfa expression. (d) Representative images from stills of a time-lapse movie of a 6 dpf nkx2.2a:gal4;UAS:NTR-mcherry;ctgfa:egfp larva (n = 6 nerves in 4 larvae). A single z-plane image demonstrates potential regions of co-localization of perineurial glia (magenta) and ctgfa expression (green) at 8 hpi. Solid white arrows follow bridging perineurial glia across the injury site. Open white arrows indicate ctgfa expression that might co-localize with perineurial glia. Open yellow arrows specify increased ctgfa expression that does not co-localize with perineurial glia. (e,f) Representative images from stills of time-lapse movies of 5 or 6 dpf ctgfa:egfp;olig2:dsred larvae. Larvae were either treated with 1% DMSO (E; n = 4 nerves in 3 larvae) or 10 μM SB431542 (F; n = 4 nerves in 3 larvae). White arrows follow the increase in ctgfa expression proximal to the injury site and yellow arrows follow the increase in ctgfa distal to the injury site. Scale bars, 25 μm; magnified insets, 10 μm.
Acknowledgments
This image is the copyrighted work of the attributed author or publisher, and
ZFIN has permission only to display this image to its users.
Additional permissions should be obtained from the applicable author or publisher of the image.
Full text @ Glia