
Image
|
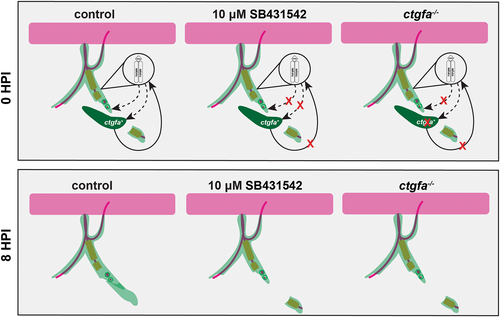
Figure Caption
Fig. 11
Perineurial glial bridging is modulated by a positive feedback loop between TGFβ signaling and ctgfa. Summary diagram of our proposed signaling model that drives perineurial glial bridging after injury in control, 10 μM SB431542, and ctgfa−/− conditions at 0 (top panels) and 8 hpi (bottom panels). Motor axons (magenta), Schwann cells (orange), perineurial glia (light green), ctgfa expressing cells (dark green). The magnified region designates perineurial glial-specific TGFβ signaling. Dotted-lines indicate TGFβ signaling whereas solid lines indicate ctgfa signaling. Red “X”s demonstrate pathways that are inhibited or turned off in either 10 μM SB431542 treatment or ctgfa−/− larvae.
Acknowledgments
This image is the copyrighted work of the attributed author or publisher, and
ZFIN has permission only to display this image to its users.
Additional permissions should be obtained from the applicable author or publisher of the image.
Full text @ Glia