
Image
|
Figure Caption
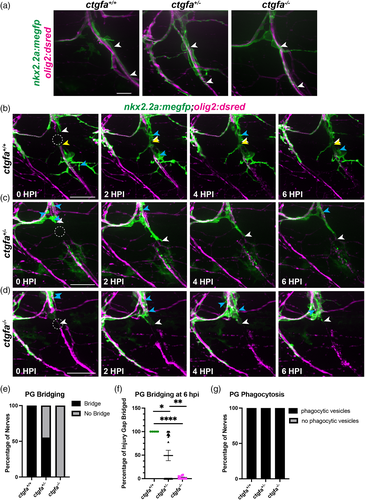
Fig. 9
Perineurial glial bridging is perturbed in ctgfa mutants. (a) Representative images prior to injury of 5 dpf ctgfa+/+, ctgfa+/−, and ctgfa−/− nkx2.2a:megfp;olig2:dsred larvae. White arrows indicate healthy perineurial glia fully ensheathing motor nerves. (b–d) 5 or 6 dpf larvae with ctgfa+/+ (n = 5 nerves in 4 larvae), ctgfa+/− (n = 19 nerves in 10 larvae), or ctgfa−/− (n = 11 nerves in 6 larvae) genotypes. (b–d) Representative images from time-lapse movies of 5 or 6 dpf ctgfa+/+ (b), ctgfa+/− (c), or ctgfa−/− (d) larvae where spinal motor nerves were injured. Dashed circles indicate injury site. White arrows follow the proximal end and yellow arrows follow the distal end of the perineurial glial bridge. Blue arrows specify perineurial glial phagocytic vesicles. (e) Quantification of percentage of nerves in which perineurial glia bridged (black) or did not bridge (gray) across ctgfa+/+, ctgfa+/−, or ctgfa−/− genotypes. (f) Quantification of the percentage of the injury gap bridged by perineurial glia at 6 hpi by ctgfa+/+, ctgfa+/−, or ctgfa−/− larvae (mean ± SEM: ctgfa+/+: 100 ± 0; ctgfa+/−: 49.21 ± 11.06; ctgfa−/−: 2.18 ± 0.96. p values: ctgfa+/+ vs. ctgfa+/−: p = .0301; ctgfa+/+ vs. ctgfa−/−: p < .0001; ctgfa+/− vs. ctgfa−/−: p = .0033). (g) Quantification of presence of phagocytic vesicles in ctgfa+/+, ctgfa+/−, or ctgfa−/− larvae. Phagocytic vesicles were present in 100% of larvae across all genotypes. Scale bars, (a) pre-injury images, 10 μm; (b–d) 25 μm.
Acknowledgments
This image is the copyrighted work of the attributed author or publisher, and
ZFIN has permission only to display this image to its users.
Additional permissions should be obtained from the applicable author or publisher of the image.
Full text @ Glia