
Image
|
Figure Caption
Fig. 10
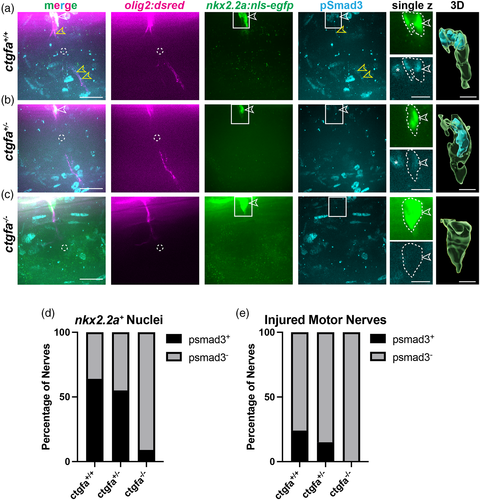
pSmad3 expression is absent in nkx2.2a+ nuclei in ctgfa mutants. (a–c) Representative images of 5 or 6 dpf larvae with motor axons (magenta), nkx2.2a+ nuclei (green), and anti-pSmad3 (cyan) in ctgfa+/+ (a), ctgfa+/− (b), and ctgfa−/− (c) larvae at 3 hpi. Anti-pSmad3 labeling is observed in nkx2.2a+ nuclei (open white arrows) and along the motor nerve (open yellow arrows) in ctgfa+/+ and some ctgfa+/− larvae. ctgfa−/− larvae show loss of anti-pSmad3 staining in nkx2.2a+ nuclei at 3 hpi. Dashed circles indicate injury sites. Solid-line boxes indicate the area represented in enhanced single z planes and nuclei in 3D rendered images (Imaris). White dotted-lines outline nkx2.2a+ nuclei and anti-pSmad3 labeling. (d,e) Quantification of the percentage of nerves that had anti-pSmad3+ labeling (black) co-localized with nkx2.2a+ nuclei (d) or motor nerves (e). Chi-square tests were performed to determine significance (ctgfa+/+: n = 52 nerves in 10 larvae, ctgfa+/−: n = 20 nerves in 7 larvae, ctgfa−/−: n = 23 nerves in 6 larvae). (d) 64% of ctgfa+/+ nerves, 55% of ctgfa+/− nerves, and 9% of ctgfa−/− nerves had anti-pSmad3+ labeling in nkx2.2a+ nuclei (Chi-square: 71.16, df: 2, p < .0001). (e) 24% of ctgfa+/+ nerves, 15% of ctgfa+/− nerves, and 0% of ctgfa−/− nerves had anti-pSmad3+ labeling in nkx2.2a+ nuclei (Chi-square: 25.99, df: 2, p < .0001). Scale bars, 25 μm; magnified insets, 10 μm; 3D renderings, 5 μm.
Acknowledgments
This image is the copyrighted work of the attributed author or publisher, and
ZFIN has permission only to display this image to its users.
Additional permissions should be obtained from the applicable author or publisher of the image.
Full text @ Glia