
Image
|
Figure Caption
Fig. 3
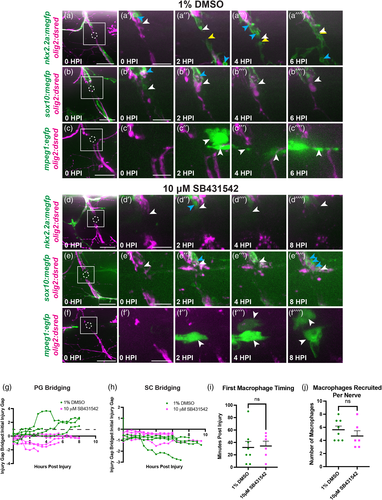
Inhibition of TGFβ signaling perturbs perineurial glial bridging. (a–f) Representative stills from time-lapse movies of 5–6 dpf larvae with injured spinal motor nerves (magenta) treated with either 1% DMSO (a–c) or 10 μM SB431542 (d–f). The dashed circle indicates the injury site while the solid line box indicates the regions of interest highlighted in adjacent insets. Blue arrows specify phagocytic vesicles. (a,d) White arrows follow the proximal end and yellow arrows follow the distal end of the perineurial glial bridge (green). (b,e) White arrows follow the proximal Schwann cell stump (green). (c,f) White arrows show macrophages (green) present in the injury site. (g,h) Quantification of either perineurial glial (PG) bridging (g) or Schwann cell (SC) bridging (h) over 8 hpi in both DMSO (green) and SB431542-treated (magenta) groups. Measurements of perineurial glial membrane (g) or Schwann cell (h) extension into the injury site were compared to the size of the initial injury gap, with values over 1 (dotted-line) indicating complete bridging and values less than zero indicating retraction away from the injury site. (g) All DMSO-treated larvae (n = 5 nerves in 4 larvae) demonstrated complete bridging while perineurial glia in all SB432542-treated larvae (n = 6 nerves in 4 larvae) failed to bridge the injury gap. (h) Schwann cells in both DMSO (n = 4 nerves in 3 larvae) and SB431542-treated larvae (n = 4 nerves in 3 larvae) did not bridge across the injury site. (i) Quantification of the timing of the first macrophage to enter the injury site in both DMSO (green, n = 8 nerves in 5 larvae; mean: 31.88 ± 0 min) and SB431542-treated (magenta, n = 6 nerves in 4 larvae; mean: 34.175.62 ± 0 min) larvae (p = .3335). (j) Quantification of the number of macrophages per nerve recruited to the injury site over 8 hpi in both DMSO (green, n = 8 nerves in 5 larvae; mean: 5.62 ± 0 macrophages) and SB431542-treated (magenta, n = 6 nerves in 4 larvae; mean: 4.67 ± 0 macrophages) larvae (p = .8655). Scale bar, (a–f) 25 μm; (a'–f″) magnified insets, 10 μm.
Acknowledgments
This image is the copyrighted work of the attributed author or publisher, and
ZFIN has permission only to display this image to its users.
Additional permissions should be obtained from the applicable author or publisher of the image.
Full text @ Glia