
- Title
-
Analytical Approaches for the Segmentation of the Zebrafish Brain Vasculature
- Authors
- Kugler, E.C., Rampun, A., Chico, T.J.A., Armitage, P.A.
- Source
- Full text @ Curr Protoc
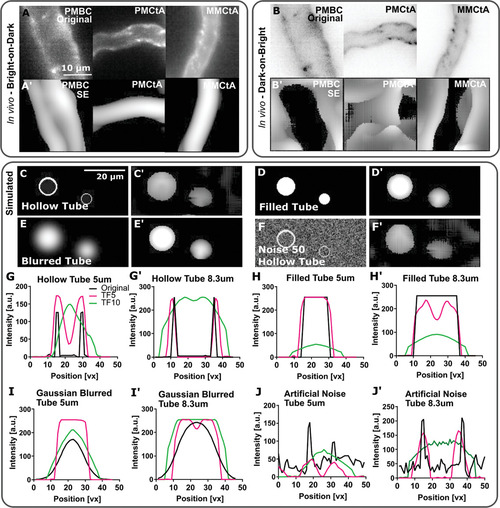
Vessel enhancement based on vascular tubularity and impact of the input shape. (A) Original data with bright vessels against a dark background. (A′) Data processed with Sato enhancement showed successful enhancement. (B) Inverted data with dark vessels against a bright background. (B′) SE was not able to perform after grayscale inversion. (C,C′) Applying SE to hollow tubes results in double-to-single peak conversion. (D,D′) Filling tubes with SE results in successful enhancement. (E,E′) SE enhancement results for Gaussian blurred tubes were similar to unblurred tubes. (F,F′) Addition of artificial Gaussian noise at level 50 did not significantly alter SE enhancement results. |
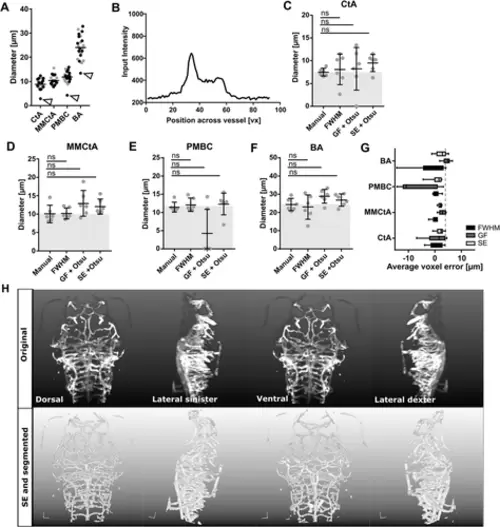
Validation of segmentation accuracy. (A) Comparing manual measurements (gray dots) to automated FWHM (black dots) showed good agreement. White arrowheads indicate outliers caused by skewed cross-sectional intensity distributions. (B) Comparison of manual measurements to FWHM, after GF with thresholding and SE with thresholding in the CtA (C), MMCtA (D), PMBC (E), and BA (F). Figures C-F show the Kruskal-Wallis test results. (G) Average voxel error is independent of vessel diameter (averaged n = 6; 3 dpf embryos). (H) Visual comparison of original data to images after SE and segmentation using 3D rendering. |
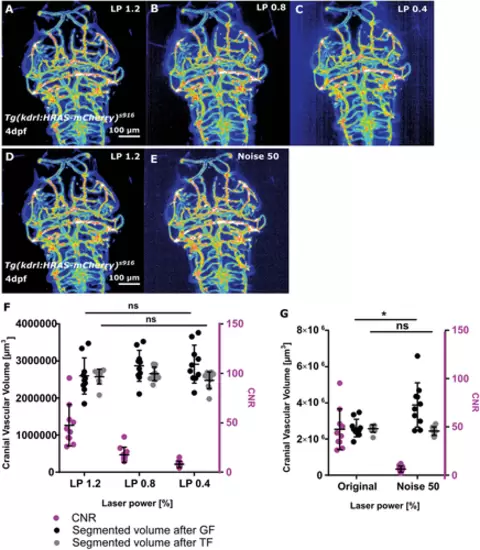
Validation of segmentation robustness. (A-C) Dataset with decreased image quality was produced by repeated image acquisition with reduced laser power (LP; 1.2%, 0.8%, and 0.4%). (D-E) Data augmentation was achieved by addition of noise to images of LP 1.2%.(F) In experimentally derived data, CNR (magenta) decreased as LP decreased. No statistically significant difference in vascular volume was observed after GF (p = 0.3248; black) or SE (p = 0.9981; gray) by LP reduction (n = 10; 4 dpf embryos; two experimental repetitions; one-way ANOVA). (G) In augmented data, CNR was also decreased (magenta). Vascular volume showed a statistically significant increase following GF (p = 0.0247) but not TF (p>0.9999). |
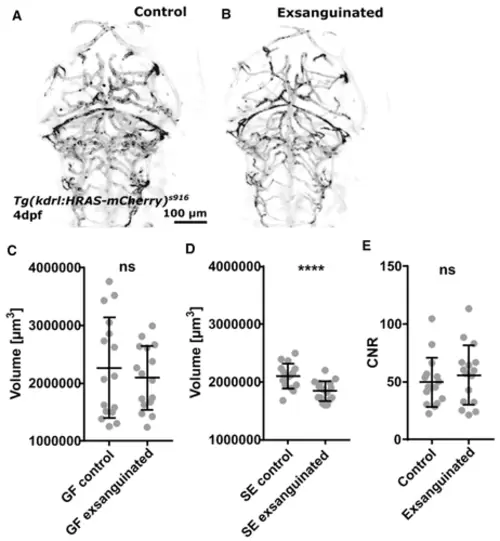
Validation of segmentation sensitivity. (A-B) Data were acquired before and after exsanguination. (C) Vascular volume was not statistically significantly different when comparing controls to exsanguinated samples after GF (p 0.2596; n = 16; 4 dpf embryos; two experimental repeats; paired t-test). (D) Vascular volume showed a statistically significant decrease when comparing controls to exsanguinated samples after SE (p < 0.0001; paired t-test). (E) CNR did not show a statistically significant change in the exsanguination procedure (p = 0.0876; paired t-test). |
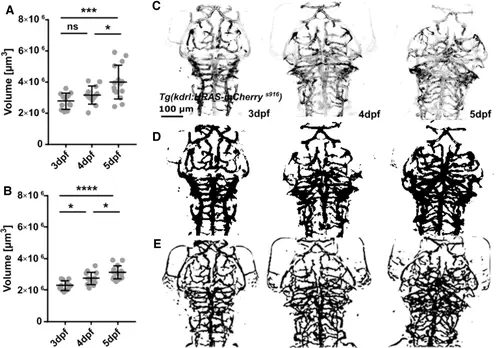
Application to quantify cerebral vascular volume. (A) Vascular volume showed a statistically significant increase after GF from 3 to 5 dpf (p = 0.0009; 3 dpf: n = 12; 4 dpf: n = 13; 5 dpf n = 15; two experimental repetitions; one-way ANOVA). (B) Vascular volume showed a statistically significant increase after SE from 3 to 5 dpf (p < 0.0001; one-way ANOVA). (C) Visual comparison of original data with segmented data after GF (D) and SE (E) indicating that SE delivered better results. |
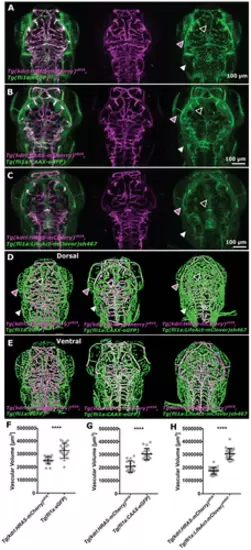
Segmentation of different transgenic lines. (A-C) In all three double transgenics [(1) Tg(fli1a:eGFP)y1, Tg(kdrl:HRAS-mCherry)s916, (2) Tg(fli1a:CAAX-eGFP), Tg(kdrl:HRAS-mCherry)s916, and (3) Tg(fli1a:LifeAct-mClover)sh467, Tg(kdrl:HRAS-mCherry)s916] nonvascular signal was observed in the fli1a-driven transgenic (arrowheads). (D-E) Segmentation results of the three double transgenics showed nonvascular signals to be enhanced and segmented in the transgenics under the fli1a promotor. (F) Vascular volume in Tg(fli1a:eGFP)y1 was statistically significantly higher than in Tg(kdrl:HRAS-mCherry)s916 (p < 0.0001; n = 21; paired t-test). (G) Vascular volume in Tg(fli1a:CAAX-eGFP) was statistically significantly higher than Tg(kdrl:HRAS-mCherry)s916 (p < 0.0001; n = 17; paired t-test). (H) Vascular volume in Tg(fli1a:LifeAct-mClover)sh467 was statistically significantly higher than Tg(kdrl:HRAS-mCherry)s916 (p < 0.0001; n = 23; paired t-test). |
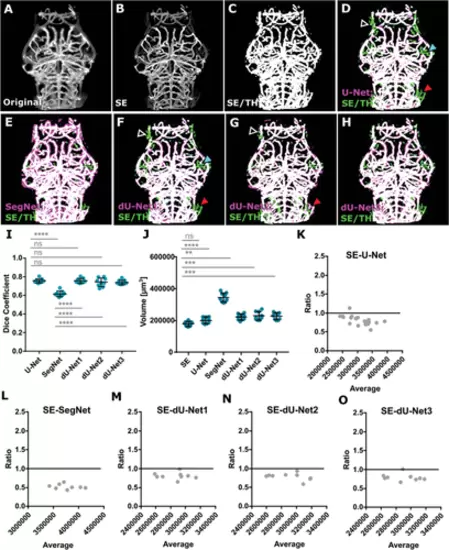
Deep learning results when trained from original data. (A) Original image, (B) enhanced, and (C) segmented using Otsu thresholding (referred to as SE/TH). (D) MIP of SE/TH (green) and original U-Net (magenta) segmentation, showing high degrees of overlap (white), whereas certain vessels were extracted with SE but not U-Net (arrowheads). (E) MIP of SE/TH (green) and SegNet (magenta) segmentation, showing consistent oversegmentation with SegNet. (F) MIP of SE/TH (green) and dU-Net1 (magenta) segmentation, showing high degrees of overlap (white), whereas certain vessels were extracted with SE/TH but not dU-Net1 (arrowheads). (G) MIP of SE/TH (green) and dU-Net2 (magenta) segmentation. (H) MIP of SE/TH (green) and dU-Net3 (magenta) segmentation. (I) Dice coefficient of segmentation outcomes (n = 9; 3 dpf). (J) Quantified vascular volumes. (K-O) Bland-Altman ratio test comparing vascular volume values. |