
Fig. 6
- ID
- ZDB-FIG-220527-12
- Publication
- Kugler et al., 2022 - Analytical Approaches for the Segmentation of the Zebrafish Brain Vasculature
- Other Figures
- All Figure Page
- Back to All Figure Page
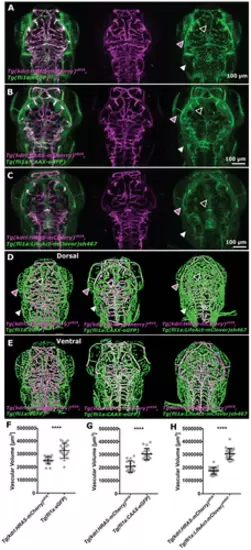
Segmentation of different transgenic lines. (A-C) In all three double transgenics [(1) Tg(fli1a:eGFP)y1, Tg(kdrl:HRAS-mCherry)s916, (2) Tg(fli1a:CAAX-eGFP), Tg(kdrl:HRAS-mCherry)s916, and (3) Tg(fli1a:LifeAct-mClover)sh467, Tg(kdrl:HRAS-mCherry)s916] nonvascular signal was observed in the fli1a-driven transgenic (arrowheads). (D-E) Segmentation results of the three double transgenics showed nonvascular signals to be enhanced and segmented in the transgenics under the fli1a promotor. (F) Vascular volume in Tg(fli1a:eGFP)y1 was statistically significantly higher than in Tg(kdrl:HRAS-mCherry)s916 (p < 0.0001; n = 21; paired t-test). (G) Vascular volume in Tg(fli1a:CAAX-eGFP) was statistically significantly higher than Tg(kdrl:HRAS-mCherry)s916 (p < 0.0001; n = 17; paired t-test). (H) Vascular volume in Tg(fli1a:LifeAct-mClover)sh467 was statistically significantly higher than Tg(kdrl:HRAS-mCherry)s916 (p < 0.0001; n = 23; paired t-test). |