
FIGURE
Fig. 2
- ID
- ZDB-FIG-220527-8
- Publication
- Kugler et al., 2022 - Analytical Approaches for the Segmentation of the Zebrafish Brain Vasculature
- Other Figures
- All Figure Page
- Back to All Figure Page
Fig. 2
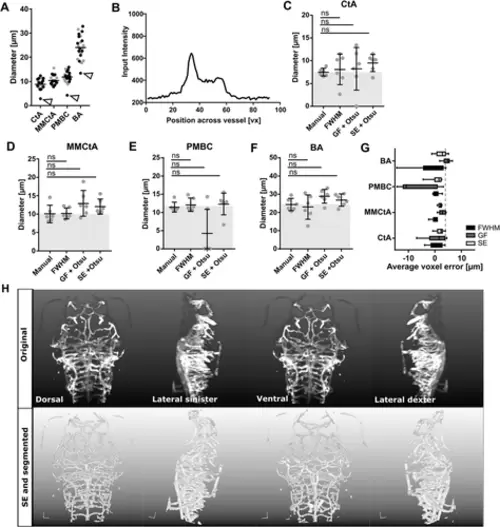
Validation of segmentation accuracy. (A) Comparing manual measurements (gray dots) to automated FWHM (black dots) showed good agreement. White arrowheads indicate outliers caused by skewed cross-sectional intensity distributions. (B) Comparison of manual measurements to FWHM, after GF with thresholding and SE with thresholding in the CtA (C), MMCtA (D), PMBC (E), and BA (F). Figures C-F show the Kruskal-Wallis test results. (G) Average voxel error is independent of vessel diameter (averaged n = 6; 3 dpf embryos). (H) Visual comparison of original data to images after SE and segmentation using 3D rendering. |
Expression Data
Expression Detail
Antibody Labeling
Phenotype Data
Phenotype Detail
Acknowledgments
This image is the copyrighted work of the attributed author or publisher, and
ZFIN has permission only to display this image to its users.
Additional permissions should be obtained from the applicable author or publisher of the image.
Full text @ Curr Protoc