
FIGURE
Fig. 5
- ID
- ZDB-FIG-220527-11
- Publication
- Kugler et al., 2022 - Analytical Approaches for the Segmentation of the Zebrafish Brain Vasculature
- Other Figures
- All Figure Page
- Back to All Figure Page
Fig. 5
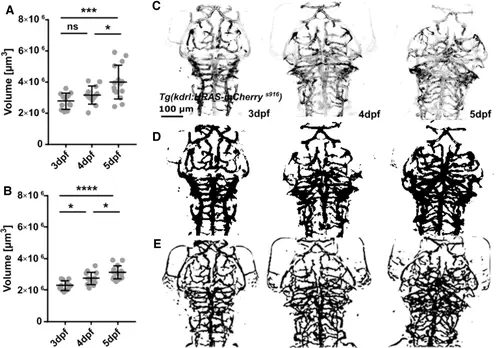
Application to quantify cerebral vascular volume. (A) Vascular volume showed a statistically significant increase after GF from 3 to 5 dpf (p = 0.0009; 3 dpf: n = 12; 4 dpf: n = 13; 5 dpf n = 15; two experimental repetitions; one-way ANOVA). (B) Vascular volume showed a statistically significant increase after SE from 3 to 5 dpf (p < 0.0001; one-way ANOVA). (C) Visual comparison of original data with segmented data after GF (D) and SE (E) indicating that SE delivered better results. |
Expression Data
Expression Detail
Antibody Labeling
Phenotype Data
Phenotype Detail
Acknowledgments
This image is the copyrighted work of the attributed author or publisher, and
ZFIN has permission only to display this image to its users.
Additional permissions should be obtained from the applicable author or publisher of the image.
Full text @ Curr Protoc