
Fig. 3
- ID
- ZDB-FIG-220527-9
- Publication
- Kugler et al., 2022 - Analytical Approaches for the Segmentation of the Zebrafish Brain Vasculature
- Other Figures
- All Figure Page
- Back to All Figure Page
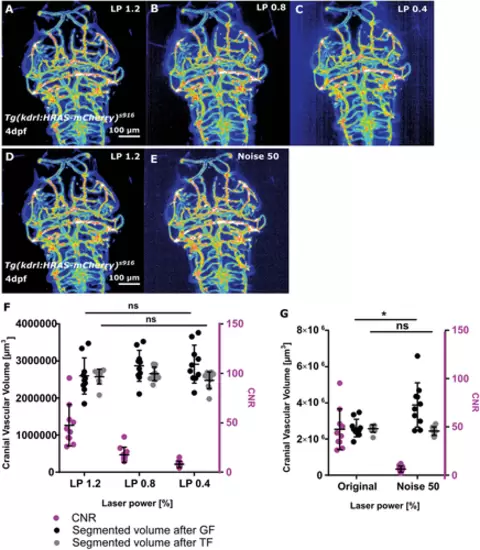
Validation of segmentation robustness. (A-C) Dataset with decreased image quality was produced by repeated image acquisition with reduced laser power (LP; 1.2%, 0.8%, and 0.4%). (D-E) Data augmentation was achieved by addition of noise to images of LP 1.2%.(F) In experimentally derived data, CNR (magenta) decreased as LP decreased. No statistically significant difference in vascular volume was observed after GF (p = 0.3248; black) or SE (p = 0.9981; gray) by LP reduction (n = 10; 4 dpf embryos; two experimental repetitions; one-way ANOVA). (G) In augmented data, CNR was also decreased (magenta). Vascular volume showed a statistically significant increase following GF (p = 0.0247) but not TF (p>0.9999). |