
- Title
-
Panx1 channels promote both anti- and pro-seizure-like activities in the zebrafish via p2rx7 receptors and ATP signaling
- Authors
- Whyte-Fagundes, P., Taskina, D., Safarian, N., Zoidl, C., Carlen, P.L., Donaldson, L.W., Zoidl, G.R.
- Source
- Full text @ Commun Biol
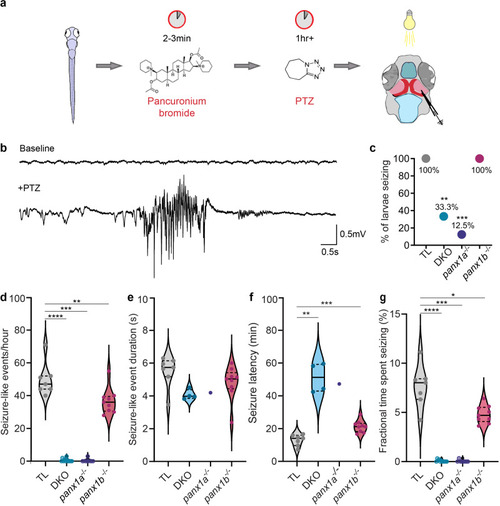
a Workflow for recording in vivo local field potentials (LFP) from the right optic tectum (OT) of 7dpf anesthetized larva after 15 mM PTZ treatment. b Representative recording of baseline activity and a seizure-like event (SLE) induced with the addition of PTZ from a TL larva. c All TL and panx1b−/− larvae had SLEs (TL (gray) n = 7/7; DKO (light blue) n = 4/12, P = 4.5 × 10⁻³; panx1a−/− (deep blue) n = 1/8, P = 3.0 × 10⁻⁴; panx1b−/− (magenta) n = 9/9, P = 1.0, Barnard test). d Quantification of SLEs in the first hour of LFP recording revealed that all panx1 knockout (KO) larvae had a significant reduction in SLEs compared to PTZ treated TL controls, presented as an average number of SLEs/hour ± s.e.m. (DKO: P = < 1.0 × 10⁻⁴; panx1a−/−: P = 3.0 × 10⁻⁴; panx1b−/−P = 5.7 × 10⁻³). e The average duration of SLEs (in seconds ± s.e.m.) for each genotype was not significantly different compared to TLs. Statistical tests were not significant for panx1a−/− due to lack of statistical power. (DKO: P = 0.07; panx1b−/−: P = 0.09). f All panx1 knockout larvae had a significant delay in the average onset time (minutes ± s.e.m.) of the first seizure-like event compared to PTZ treated TL controls. (DKO: P = 6.1 × 10⁻³; panx1b−/−: P = 3.0 × 10⁻⁴). g All panx1 knockout larvae spent significantly less time seizing compared to PTZ treated TL controls. Average fractional time spent seizing is presented in percent ± s.e.m. (DKO: P = < 1.0 × 10⁻⁴; panx1a−/−: P = 3.0 × 10⁻⁴; panx1b−/−: P = 0.01). N = number of larvae. Statistical Mann–Whitney U test in (d–g). Scale bars 0.5 mV by 0.5 s. *P < 0.05, **P < 0.01, ***P < 0.001, ****P < 0.0001. PHENOTYPE:
|

Representative 1 h long LFP traces with PTZ treatment: a TL (b) DKO, (c) panx1a−/−, and (d) panx1b−/−. TL and panx1b−/− traces showed typical seizure-like events. Single events were highlighted by red dotted lines and magnified. Blue dotted lines highlight a lack of seizure-like activity in DKO and panx1a−/− larvae. Spectrograms below the traces showed low and high-frequency power increases during seizure-like events for TL and panx1b−/−. Scale bar: A value of 0 (blue) is low, and a value of 50 (red) is high. e–h Power spectral density (PSD, mV2/Hz) measured across frequencies revealed no significant differences in baseline (dotted lines) frequencies for all genotypes (P = 0.69; Kruskal–Wallis test). e TL, gray; f DKO, light blue; g panx1a−/−, dark blue; h panx1b−/−, magenta. The power was significantly increased in the delta band (1–4 Hz) after PTZ treatment (solid line) for all genotypes except panx1a−/− (TL: P = 0.02, n = 7; DKO: P = 5.0 × 10⁻⁴, n = 12; panx1a−/−: P = 0.6, n = 8; panx1b−/−: P = 3.9 × 10⁻³, n = 9; Wilcoxon signed-rank test). The PSD was plotted as an average across traces with the shaded regions indicating ± s.e.m. Changes in delta power were quantified from the areas under the curves (AUC; highlighted in yellow) of the power spectrum. The changes in AUCs are represented as bar graphs inserted to the right of the power spectra. TL showed the greatest change in delta, followed by panx1b−/− (P = 1.0), and DKO (P = 0.4). Panx1a−/− exhibited insignificant changes (P = 2.3 × 10⁻³; Dunn’s multiple comparisons) and maintained delta power throughout recordings. N = number of larvae. Scale bars: top = 0.5 mV by 250 s and bottom = 0.2 mV by 1 s. ***P < 0.001, ****P < 0.0001, gray star - P = 2.3 × 10⁻³ compared to TL with PTZ. |
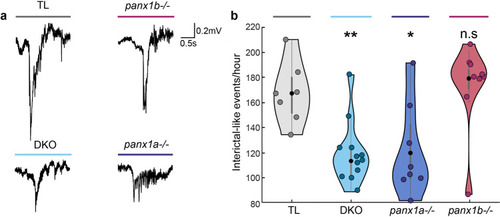
a Electrophysiological recordings of PTZ treatment showed interictal-like epileptiform discharges (IED) in all genotypes. Representative IEDs show most similarities between TL and panx1b−/− events. b Quantification of IEDs for the first hour of recording for all genotypes revealed that DKO (P = 1.3 × 10⁻³, n = 12) and panx1a−/− (P = 0.02, n = 8) had significantly fewer IEDs. No significant difference was found in the amount of IEDs for panx1b−/− larvae compared to TL (P = 0.34, panx1b−/− n = 9, TL n = 7). Data presented as an average number of events per hour ± s.e.m. N = number of larvae. Scale bar: 0.2 mV by 0.5 s. *P < 0.05, **P < 0.01, Mann–Whitney U test. PHENOTYPE:
|
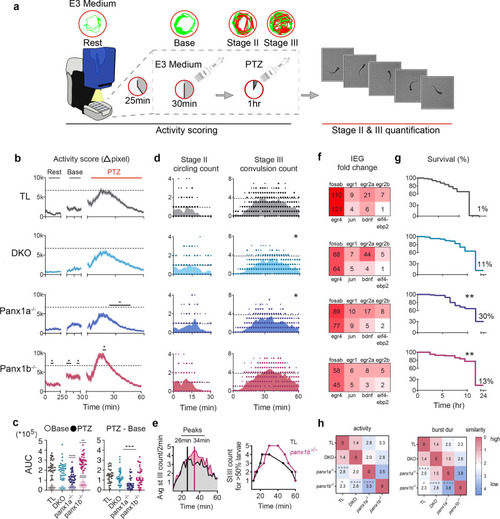
a Methodological workflow of behavioral assays in TL and panx1 knockout larvae. b Larvae’s (n = 36/genotype) baseline and 15 mM PTZ-induced activity (Δpixel ± s.e.m.) were scored. Panx1b−/− baseline activity was higher than TL (P = < 1.0 × 10⁻⁴). PTZ induced hyperactivity peaked at 15–30 min for TL (gray), was reduced in DKO (light blue), significantly reduced in panx1a−/− (dark blue, P = < 1.0 × 10⁻⁴) for the last 40 min, and significantly increased in panx1b−/− larvae (magenta, P = 1.3 × 10⁻³) around 20 min compared to TL; Two-way repeated measures ANOVA and Bonferroni multiple comparisons. Dashed lines indicate TL’s max average activity score. c AUC derived from the activity plots in (b) significantly differed between TL and panx1b−/− baselines (open points; P < = 1.0 × 10⁴). AUC for 1 h post-PTZ treatment was significantly reduced for panx1a−/− (P = < 1.0 × 10⁻⁴) and increased for panx1b−/− (filled points; P = 5.7 × 10⁻³). Change in PTZ treatment from average baseline activity was significantly reduced in panx1a−/− compared to TL (P = 2.0 × 10⁻⁴; Tukey’s multiple comparisons test). d Stage II count (rapid circling) did not differ among groups (n = 18; count/2 min). Stage III (convulsion) was significantly reduced in DKO (P = 1.5 × 10⁻²) and panx1a−/− (P = 0.02; Two-way repeated measures ANOVA) compared to TL. Dashed lines represent max average stage II and stage III counts for TL. e Time course of average stage III counts differed between the two groups, peaking at 26 min post-PTZ treatment for TL and 34 min for panx1b−/−. Time course where >50% of the larvae reached 1–5 stage III counts revealed a delayed peak onset for panx1b−/−. f IEG upregulation after 1 h PTZ treatment, represented as fold-change for PTZ treated larvae against non-treated controls. Panx1 knockout larvae had reduced upregulation of the IEGs compared to TL, with DKO and panx1b−/− showing the greatest reduction. (N = 3 experimental replicates). g Survival rate of larvae (n = 80) post-PTZ treatment was significantly higher for panx1a−/− followed by panx1b−/−, and the survival rate of DKOs did not differ from TL. Survival at 24 h: TL: 1.25%, DKO: 11%; P = 0.38, panx1a−/−: 30%; P = 8.8 × 10⁻³, panx1b−/−: 13%; P = 8.1 × 10⁻³; Mantel–Cox test. h SOM revealed similarities and differences in PTZ-induced activity and bursting behaviors of TL and panx1 knockouts (n = 36). TL and DKO were most similar, panx1a−/− differed the most from TL (P < 0.0001; Fisher’s exact test), and panx1a−/− and panx1b−/− were most distinct (P < 0.0001). Values and color represent the degree of similarity. N = number of larvae. *P < 0.05, **P < 0.01, ***P < 0.001, ****P < 0.0001. |
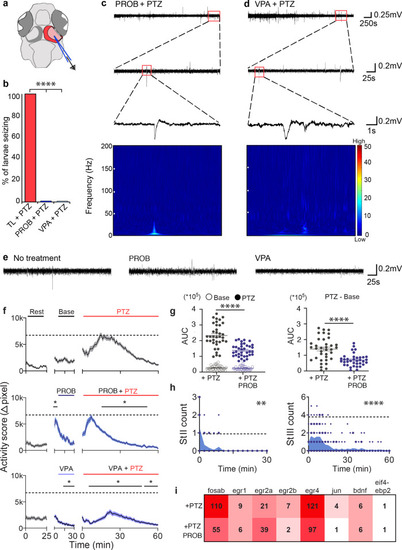
a Schematic of the region LFPs were recorded from. b Larvae treated with 75 µM PROB (n = 7; P = 6.1 × 10⁻⁵) or 5 mM VPA (n = 7; P = 6.1 × 10⁻⁶) have no PTZ inducible SLEs compared to 100% of TL larvae (n = 7; Barnard test). Representative traces of larvae treated with (c) PROB and (d) VPA treated with PTZ for 60 min. Expanded views into the last 5 min of traces showed lack of SLEs. Spectrograms corresponding to small spikes in traces above demonstrate no increase in high-frequency power associated with these events. Scale bar: A value of 0 (blue) is low and a value of 50 (red) is high. e LFPs of the last 5 min of 60 min traces revealed no drug induced changes to baseline activity when using PROB or VPA. f Baseline activity (∆pixel ± s.e.m.; n = 36; Two-way repeated measures ANOVA and Bonferroni multiple comparisons) increased with PROB treatment for the first 5 min (P = < 9.0 × 10⁻⁴), PTZ-induced hyperactivity subsided significantly within 15 min (P = < 1.0 × 10⁻⁴), sooner than the PTZ only group. VPA treatment (n = 60) decreased baseline and PTZ-induced activity (P = < 1.0 × 10⁻⁴), with a hyperactivity curve like the PTZ only group. Dashed lines indicate max average activity for PTZ only group. g AUCs for baseline activity and PROB treatment did not differ (open points; P = 0.5). PROB treatment significantly reduced the effect of PTZ without (filled points; P = < 1.0 × 10⁻⁴) and with (P = < 1.0 × 10⁻⁴; Unpaired t-test) extracted baseline activity. h Stage II and III counts (n = 18; count/2 min) were significantly reduced with PROB treatment (stage II: P = 5.7 × 10⁻³; stage III: P ≤ 1.0 × 10⁻⁴; Two-way repeated measures ANOVA), majority occurring in the first 10 min of treatment. Dashed lines represent max average Stage II and Stage III counts for PTZ-only group. i IEG upregulation was reduced in PROB treated TL larvae except for egr2a. N = number of larvae. Scale bars: Top = 0.25 mV by 250 s, middle = 0.2 mV by 25 s, bottom = 0.2 mV by 1 s, e = 0.2 mV by 25 s. *P < 0.05, **P < 0.01, ***P < 0.001, ****P < 0.0001. |

a Gene ontology enrichment of biological processes for differentially regulated genes from RNA-seq data of DKO, panx1a−/−, and panx1b−/− found using the FishEnrichR database. Biological processes were grouped into five categories; transport (GO:0006810), signal transduction (GO:0007165), metabolism (GO:0008152), cellular respiration (GO:0045333), and cell death (GO:0008219). Data is presented as -log P value based on Fisher’s exact test. The dot size represents the combined score for genes associated with that pathway. Dotted gray lines indicate P = 0.05. b Candidate genes were selected, and RNA-seq data was mined for differential regulation in panx1 fish lines. Clustergrams compare panx1 knockout larvae for correlation amongst chosen genes for (1) transport, (2) extracellular ATP (release & degradation), (3) metabolism (respirasome & oxidative phosphorylation) and (4) solute carriers. The scale bar shows standardized correlation values (SCV) calculated by the Matlab Clustergram function. Range: red is positive, and blue is negative. Hierarchical cluster branches are shown above each clustergram and labeled below. c Expression (logpadj) of genes part of the ATP release (top) and solute carrier (bottom) clustergrams for panx1a−/− (blue) and panx1b−/− (top). Filled bars indicate upregulated genes; empty bars are downregulated. P = 0.05 indicated with dotted line. |
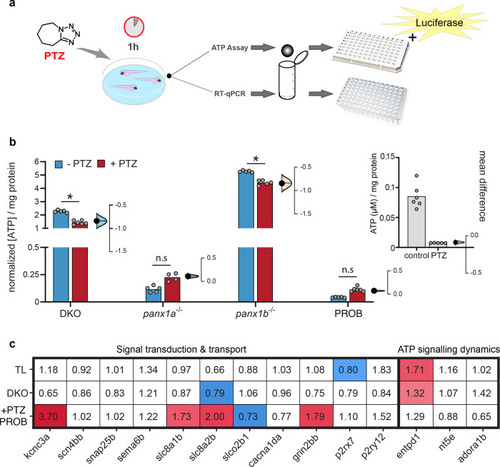
a Workflow diagram outlining the 1 h PTZ incubation for treated larvae. Larvae were collected for either RT-qPCR (n = 30 larvae/sample, N = 3 experimental replicates) or ATP assays (n = 50 larvae/sample, N = 5 experimental replicates), followed by homogenization prior to samples being plated in 96well format for measurement. Note that for ATP detection, luciferase was used. b Estimation plots of extracellular ATP concentrations (µM) concerning larval protein content (mg/ml) and normalized to the respective TL control. Extracellular ATP for TL controls is shown on the right (b), showing a significant decrease in ATP with PTZ treatment (P = < 1.0 × 10⁻⁴). Baseline ATP values are depicted by the blue bars, PTZ treatment is in red, and individual data points are displayed in gray to show data distribution. Difference of means is shown to the right of each group, with a 95% confidence interval to show effect size and significance. DKO (Δ mean = −0.84) and panx1b−/− (Δ mean = −0.84) show a significant decrease in ATP with PTZ treatment. Panx1a−/− (Δ mean = 0.1) and TL larvae with PROB (Δ mean = 0.07) show very low ATP concentrations; however, they do show a slight increase in ATP with PTZ treatment which is not significant. Panx1b−/− has the highest presence of ATP. (DKO: P = < 1.0 × 10⁻⁴; panx1a−/−: P = 0.98; panx1b−/−: P = < 1.0 × 10⁻⁴; PROB: P = 1.0; Tukey’s multiple comparisons test). c RT-qPCR of selected genes grouped into signal transduction and transport, or ATP signaling dynamic categories, showing significant up (red) or down (blue) regulation, with respect to non-treated controls, in response to PTZ treatment for TL, DKO and TLs treated with PROB. (N = 3 experimental replicates). *P < 0.0001. |
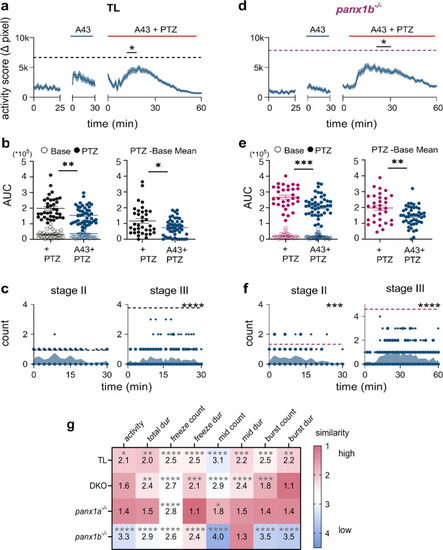
a 100 µM A-438079 (A43) treatment decreased hyperactivity in TL in the first 10 min of PTZ treatment (∆pixel ± s.e.m.; n = 46; P = 2.1 × 10⁻³). The dashed gray line indicates TL’s max average activity score treated with only PTZ (n = 36). b AUCs for TL’s baseline activity and A43 treatment did not differ (open points; P = 0.9). A43 treatment significantly reduced the effect of PTZ without (filled points; P = 2.4 × 10⁻³) and with (P = 4.5 × 10⁻²) extracted baseline activity. c Stage III count (count/2 min) was significantly reduced with A43 treatment in TL (n = 18; P = < 1.0 × 10⁻⁴). Dashed lines represent max average Stage II and Stage III counts for TL’s PTZ-only group. d A43 treatment decreased PTZ-induced hyperactivity in panx1b−/− (n = 46; P = 4.0 × 10⁻⁴). The dashed magenta line indicates panx1b−/−’s max average activity in the PTZ only group (n = 31). e A43 treatment significantly reduced the effect of PTZ in panx1b−/− without (filled points; P = 5.0 × 10⁻⁴) and with (P = 8.7 × 10⁻³) extracted baseline activity. f Stage II and III counts were significantly reduced with A43 treatment in panx1b−/− (n = 18; stage II: P = 1.0 × 10⁻⁴; stage III: P ≤ 1.0 × 10⁻⁴). Dashed lines represent max average Stage II and Stage III counts for panx1b−/−’s PTZ-only group. g SOM revealed changes to the PTZ phenotype in TL with A43 treatment (n = 46) for freezing and normal locomotor behaviors (P < 0.0001). A43 treatment resembled panx1a−/−‘s PTZ phenotype the most, and panx1b−/−‘s the least, as seen in normal (mid count P < 0.0001) and bursting behaviors (P < 0.0001). Smaller value and warmer color represent higher similarity. Statistical tests used: Two-way repeated measures ANOVA and Bonferroni multiple comparisons for(a, c, d & f); Mann–Whitney U test for (b and e). Fisher’s exact test for (g). N = number of larvae. *P < 0.05, **P < 0.01, ***P < 0.001, ****P < 0.0001. PHENOTYPE:
|
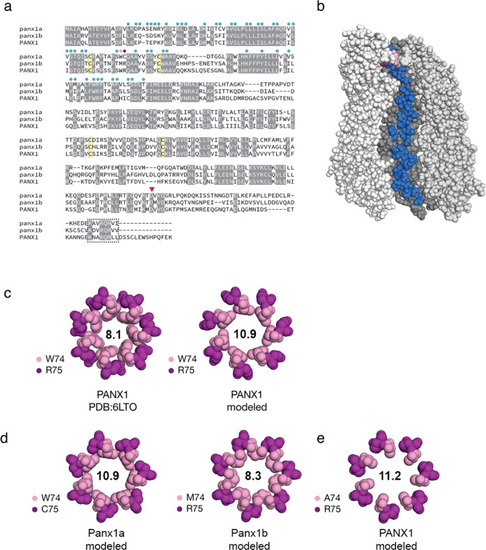
a Protein sequence alignment of full-length human pannexin-1 (PANX1; amino acids (aa): 1-426) and zebrafish Panx1a (aa 1-416), and Panx1b (aa 1-422). Circles above the sequence alignment indicate amino acids that line the channel. Two amino acids at positions 74 and 75 form an extracellular gate (in pink and purple, respectively). Four cysteines (in yellow) contribute to two functionally important disulfide bonds. A red triangle denotes a caspase cleavage site located in the carboxyterminal domain. A box indicates a conserved carboxy-terminal segment of unknown significance. b Amino acids that line the inside of the channel are shown on one monomer of heptameric human PANX1 (PDB: 6LTO; aa 1-341 55). The channel is oriented with the extracellular-facing side of the channel at the top. c The human PANX structure was used to model the extracellular gate of zebrafish Panx1a/Panx1b by substituting as required and repacking only amino acids 74/75 against a rigid backbone. As a control, human PANX1 was subjected to the same refinement and repacking protocol, creating a larger extracellular gate than the original cryo-EM structure. The diameters of the respective gates (in angstroms) are shown. d Molecular models of the extracellular gates of zebrafish Panx1a/Panx1b. Each protein bears one substitution relative to the human PANX1 structure. e An alanine was modeled to mimic a constitutively ATP-permeable state. Molecular graphics were produced with PyMOL v2.4.1 (Schrödinger, LLC). |

ZFIN is incorporating published figure images and captions as part of an ongoing project. Figures from some publications have not yet been curated, or are not available for display because of copyright restrictions. EXPRESSION / LABELING:
|