
Fig. 4
- ID
- ZDB-FIG-220520-41
- Publication
- Whyte-Fagundes et al., 2022 - Panx1 channels promote both anti- and pro-seizure-like activities in the zebrafish via p2rx7 receptors and ATP signaling
- Other Figures
- All Figure Page
- Back to All Figure Page
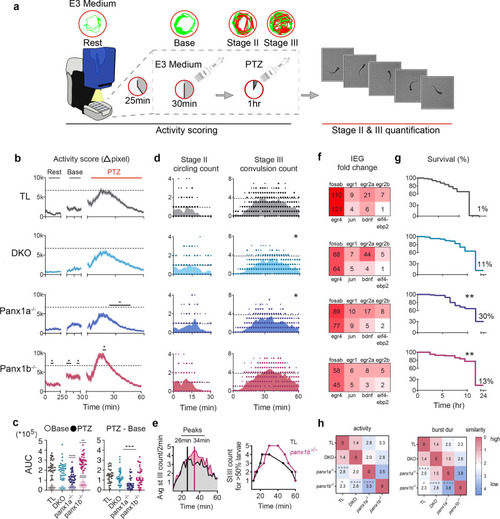
a Methodological workflow of behavioral assays in TL and panx1 knockout larvae. b Larvae’s (n = 36/genotype) baseline and 15 mM PTZ-induced activity (Δpixel ± s.e.m.) were scored. Panx1b−/− baseline activity was higher than TL (P = < 1.0 × 10⁻⁴). PTZ induced hyperactivity peaked at 15–30 min for TL (gray), was reduced in DKO (light blue), significantly reduced in panx1a−/− (dark blue, P = < 1.0 × 10⁻⁴) for the last 40 min, and significantly increased in panx1b−/− larvae (magenta, P = 1.3 × 10⁻³) around 20 min compared to TL; Two-way repeated measures ANOVA and Bonferroni multiple comparisons. Dashed lines indicate TL’s max average activity score. c AUC derived from the activity plots in (b) significantly differed between TL and panx1b−/− baselines (open points; P < = 1.0 × 10⁴). AUC for 1 h post-PTZ treatment was significantly reduced for panx1a−/− (P = < 1.0 × 10⁻⁴) and increased for panx1b−/− (filled points; P = 5.7 × 10⁻³). Change in PTZ treatment from average baseline activity was significantly reduced in panx1a−/− compared to TL (P = 2.0 × 10⁻⁴; Tukey’s multiple comparisons test). d Stage II count (rapid circling) did not differ among groups (n = 18; count/2 min). Stage III (convulsion) was significantly reduced in DKO (P = 1.5 × 10⁻²) and panx1a−/− (P = 0.02; Two-way repeated measures ANOVA) compared to TL. Dashed lines represent max average stage II and stage III counts for TL. e Time course of average stage III counts differed between the two groups, peaking at 26 min post-PTZ treatment for TL and 34 min for panx1b−/−. Time course where >50% of the larvae reached 1–5 stage III counts revealed a delayed peak onset for panx1b−/−. f IEG upregulation after 1 h PTZ treatment, represented as fold-change for PTZ treated larvae against non-treated controls. Panx1 knockout larvae had reduced upregulation of the IEGs compared to TL, with DKO and panx1b−/− showing the greatest reduction. (N = 3 experimental replicates). g Survival rate of larvae (n = 80) post-PTZ treatment was significantly higher for panx1a−/− followed by panx1b−/−, and the survival rate of DKOs did not differ from TL. Survival at 24 h: TL: 1.25%, DKO: 11%; P = 0.38, panx1a−/−: 30%; P = 8.8 × 10⁻³, panx1b−/−: 13%; P = 8.1 × 10⁻³; Mantel–Cox test. h SOM revealed similarities and differences in PTZ-induced activity and bursting behaviors of TL and panx1 knockouts (n = 36). TL and DKO were most similar, panx1a−/− differed the most from TL (P < 0.0001; Fisher’s exact test), and panx1a−/− and panx1b−/− were most distinct (P < 0.0001). Values and color represent the degree of similarity. N = number of larvae. *P < 0.05, **P < 0.01, ***P < 0.001, ****P < 0.0001. |
| Genes: | |
|---|---|
| Fish: | |
| Condition: | |
| Anatomical Term: | |
| Stage: | Day 6 |
| Fish: | |
|---|---|
| Condition: | |
| Observed In: | |
| Stage Range: | Day 6 to Days 7-13 |