
Fig. 5
- ID
- ZDB-FIG-220520-42
- Publication
- Whyte-Fagundes et al., 2022 - Panx1 channels promote both anti- and pro-seizure-like activities in the zebrafish via p2rx7 receptors and ATP signaling
- Other Figures
- All Figure Page
- Back to All Figure Page
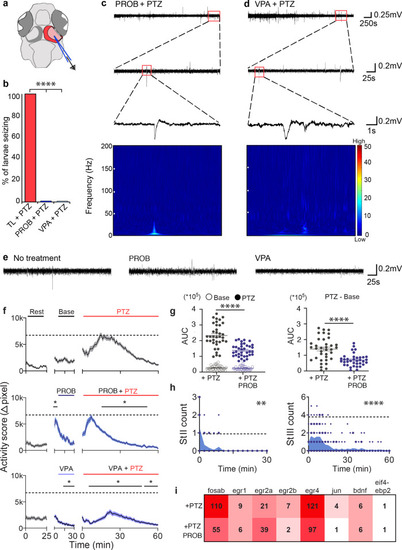
a Schematic of the region LFPs were recorded from. b Larvae treated with 75 µM PROB (n = 7; P = 6.1 × 10⁻⁵) or 5 mM VPA (n = 7; P = 6.1 × 10⁻⁶) have no PTZ inducible SLEs compared to 100% of TL larvae (n = 7; Barnard test). Representative traces of larvae treated with (c) PROB and (d) VPA treated with PTZ for 60 min. Expanded views into the last 5 min of traces showed lack of SLEs. Spectrograms corresponding to small spikes in traces above demonstrate no increase in high-frequency power associated with these events. Scale bar: A value of 0 (blue) is low and a value of 50 (red) is high. e LFPs of the last 5 min of 60 min traces revealed no drug induced changes to baseline activity when using PROB or VPA. f Baseline activity (∆pixel ± s.e.m.; n = 36; Two-way repeated measures ANOVA and Bonferroni multiple comparisons) increased with PROB treatment for the first 5 min (P = < 9.0 × 10⁻⁴), PTZ-induced hyperactivity subsided significantly within 15 min (P = < 1.0 × 10⁻⁴), sooner than the PTZ only group. VPA treatment (n = 60) decreased baseline and PTZ-induced activity (P = < 1.0 × 10⁻⁴), with a hyperactivity curve like the PTZ only group. Dashed lines indicate max average activity for PTZ only group. g AUCs for baseline activity and PROB treatment did not differ (open points; P = 0.5). PROB treatment significantly reduced the effect of PTZ without (filled points; P = < 1.0 × 10⁻⁴) and with (P = < 1.0 × 10⁻⁴; Unpaired t-test) extracted baseline activity. h Stage II and III counts (n = 18; count/2 min) were significantly reduced with PROB treatment (stage II: P = 5.7 × 10⁻³; stage III: P ≤ 1.0 × 10⁻⁴; Two-way repeated measures ANOVA), majority occurring in the first 10 min of treatment. Dashed lines represent max average Stage II and Stage III counts for PTZ-only group. i IEG upregulation was reduced in PROB treated TL larvae except for egr2a. N = number of larvae. Scale bars: Top = 0.25 mV by 250 s, middle = 0.2 mV by 25 s, bottom = 0.2 mV by 1 s, e = 0.2 mV by 25 s. *P < 0.05, **P < 0.01, ***P < 0.001, ****P < 0.0001. |
| Genes: | |
|---|---|
| Fish: | |
| Conditions: | |
| Anatomical Term: | |
| Stage: | Day 6 |
| Fish: | |
|---|---|
| Conditions: | |
| Observed In: | |
| Stage Range: | Day 6 to Days 7-13 |