FIGURE SUMMARY
Title

Intrinsic epigenetic control of angiogenesis in induced pluripotent stem cell-derived endothelium regulates vascular regeneration

Authors
Macklin, B.L., Lin, Y.Y., Emmerich, K., Wisniewski, E., Polster, B.M., Konstantopoulos, K., Mumm, J.S., Gerecht, S.
Source
Full text @ NPJ Regen Med

iECs display extensive sprouting and a high glycolytic rate.

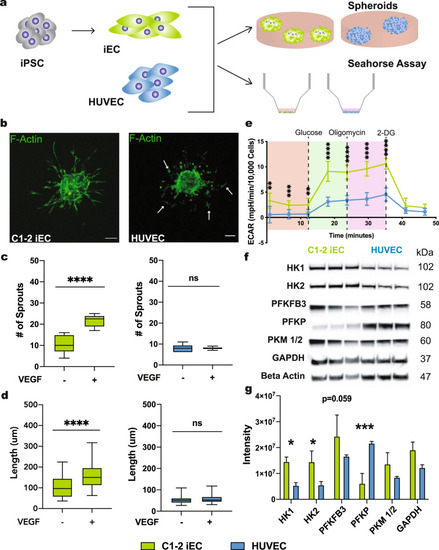
iECs derived from the C1-2 hiPSC line were analyzed for sprouting abilities. a Schematic is outlining the experimental workflow. b Representative confocal images of HUVEC (left) and iEC (right) sprouting spheroids after 24 h in collagen gel in media supplemented with or without VEGF. Arrows indicate disconnected cells. c Quantification of the average number (#) of sprouts per spheroid and d average sprout length (N = 3, n = 25–30). e Extracellular Acidification Rate measured via Seahorse Assay in C1-2 iECs and HUVECs (red, non-glycolytic acidification; green, glycolysis; purple, glycolytic max; N = 3, n = 9). f Western blot analysis of glycolysis enzymes and g quantification, N = 3. Statistical significance levels are set at *p ≤ 0.05, **p ≤ 0.01, ***p ≤ 0.001, and ****p ≤ 0.0001 by two-tailed Student’s t-test and Sidak’s multiple comparison test. For bar graphs: data are presented as mean ± SD. For box and wisker plots: centerline, median; box limits, upper and lower quartiles; wiskers, minimum to maximum value. Scale bar: 100 μm.

Filopodia formation and VEGF-dependent migration of iECs.

a Filopodia formation in C1–2 iECs and HUVECs was assessed using F-actin and Myosin X stain followed by confocal microscopy of dispersed cells. b Quantification of filopodia was analyzed using an F-actin stain with the Image J plug-in FiloQuant. (N = 3, n = 45). Graph plotted without outliers. c Schematic of the microfluidic device with amplification of the 2D cell culture and migration channels region and d image of C1-2 iEC migration in the channels with and without a VEGF gradient at t = 6 h. Arrows indicate iECs migrating through the channels. The boxed images show cells at t = 0. e Quantification of cell entry and velocity in the channel of individual cells (N = 3, n = 105–120). Statistical significance levels are set at *p ≤ 0.05, **p ≤ 0.01, ***p ≤ 0.001, and ****p ≤ 0.0001 by two-tailed Student’s t-test and Tukey’s multiple comparison test. Data are presented as mean ± SD. Scale bar: 100 μm.

High VEGFR2 expression in iECs.

a RT-qPCR data for VEGFR2 normalized to HUVECs. (N = 3; n = 9). b Representative flow cytometry data for VEGFR2 in HUVECs (blue, 6.63%) and C1-2 hiPSC-ECs (green, 99.05%) (N = 3). c Western blot analysis of VEGFR2 phosphorylation at tyrosine 996 and 1175 and d quantification. (N = 3). e RT-qPCR data for VEGF normalized to C1-2. (N = 3, n = 9). f VEGFR2 expression in HUVECs cultured with and without VEGF (50 ng/ml) and the TGFβ inhibitor, SB431542. (N = 3) Statistical significance levels are set at *p ≤ 0.05, **p ≤ 0.01, ***p ≤ 0.001, and ****p ≤ 0.0001 by two-tailed Student’s t-test and Tukey’s multiple comparison test. Data are presented as mean ± SD. Scale bar: 100 μm.

VEGFR2 inhibition in iECs.

a Representative confocal images of iEC spheroids cultured in ECGM (left), ECGM supplemented with the VEGFR2 inhibitor, ZM323881 (middle), and ZM323881 with VEGF (50 ng/ml; right). b Quantification of spheroid sprout number and length in spheroids cultured in culture media supplemented with VEGF (solid), and spheroids cultured in culture media supplemented VEGF and ZM323881 (striped). (N = 3, n = 15). c Extracellular Acidification Rate measured via Seahorse Assay in C1-2 iECs with or without ZM323881 pretreatment (N = 2, n = 6). d Western blot for HK1 and HK2 in hiPSC-ECs cultured in ZM323881 or control conditions and e quantification, N = 2. f Heat map for RT-qPCR results of mRNA expression displayed as ddCT normalized to iECs N = 2. Statistical significance levels are set at *p ≤ 0.05, **p ≤ 0.01, ***p ≤ 0.001, and ****p ≤ 0.0001 by two-tailed Student’s t-test and Tukey’s multiple comparison test. For bar graphs: data are presented as mean ± SD. For box and whisker plots: centerline, median; box limits, upper and lower quartiles; whiskers, minimum to maximum value. Scale bar: 100 μm.

hiPSC-EC VEGFR2 expression is regulated by HAT P300 activity.

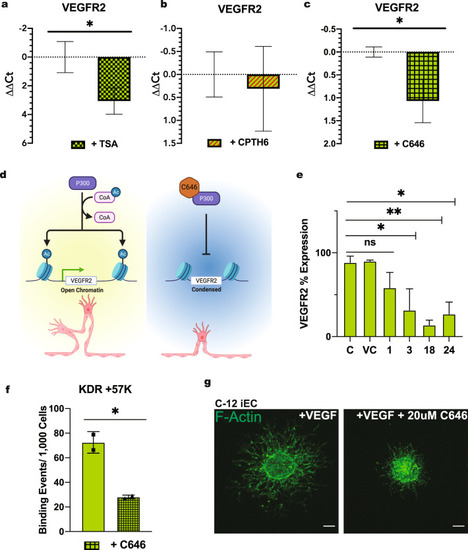
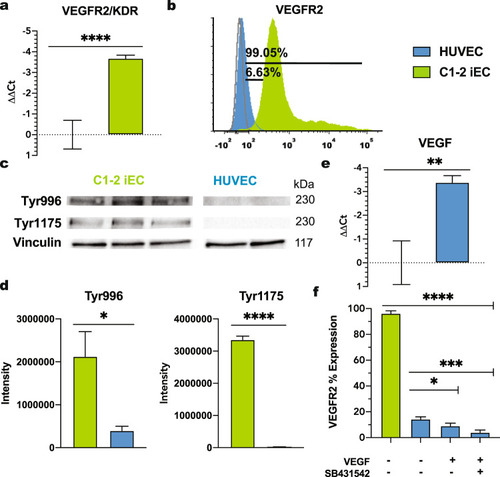
RT-qPCR for VEGFR2 in C1-2 iECs treated with a TSA, b CPTH6, and c C646. (N = 3, n = 9). d Schematic is outlining of P300 HAT VEGFR2 regulation and C646 inhibition in iECs. Schematic created with BioRender.com. e Flow cytometry for VEGFR2 on iECs treated with C646 for varying periods (C-Control, ECGM; VC-Vehicle Control, DMSO; 1,3,18, and 24 h) N = 3. f ChIP qPCR data are shown as binding events per 1000 cells to the +57 K location at the VEGFR2 transcriptional start site. N = 2. g Representative confocal microscopy images of C1-2 iECs spheroids cultured in media supplemented with VEGF or VEGF and C646. (N = 2, n = 10) (N = 2, n = 10). Statistical significance levels are set at *p ≤ 0.05, **p ≤ 0.01, ***p ≤ 0.001, and ****p ≤ 0.0001 and Tukey’s multiple comparison test by two-tailed Student’s t-test and Tukey’s multiple comparison test. Data are presented as mean ± SD. Scale bar: 100 μm.

iEC-enhanced zebrafish caudal fin regeneration is abated by p300 inhibition.

a Schematic outlining zebrafish caudal fin regeneration assay. Schematic created with BioRender.com. b Representative images of caudal fin regeneration of control (top) and iEC injected (bottom) at 6 dpf and 9 dpf and c quantification including controls (n = 35–64). d Representative images of C646 iEC injected zebrafish at 6 dpf and 9 dpf and e quantification including controls (n = 28–33). Statistical significance levels are set at *p ≤ 0.05, **p ≤ 0.01, ***p ≤ 0.001, and ****p ≤ 0.0001 by Tukey’s multiple comparison test. Data are presented as mean ± SD. Scale bar: 100 μm.

Acknowledgments
This image is the copyrighted work of the attributed author or publisher, and ZFIN has permission only to display this image to its users. Additional permissions should be obtained from the applicable author or publisher of the image. Full text @ NPJ Regen Med