|
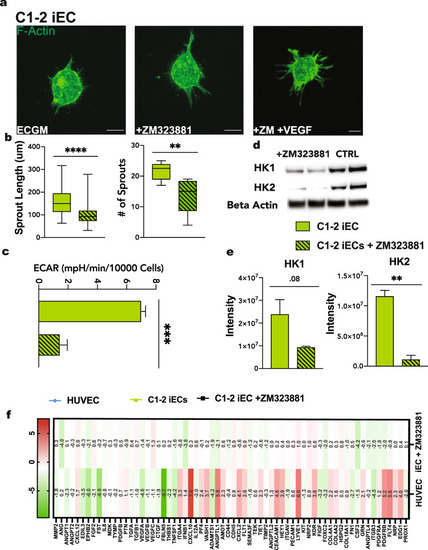
VEGFR2 inhibition in iECs.a Representative confocal images of iEC spheroids cultured in ECGM (left), ECGM supplemented with the VEGFR2 inhibitor, ZM323881 (middle), and ZM323881 with VEGF (50 ng/ml; right). b Quantification of spheroid sprout number and length in spheroids cultured in culture media supplemented with VEGF (solid), and spheroids cultured in culture media supplemented VEGF and ZM323881 (striped). (N = 3, n = 15). c Extracellular Acidification Rate measured via Seahorse Assay in C1-2 iECs with or without ZM323881 pretreatment (N = 2, n = 6). d Western blot for HK1 and HK2 in hiPSC-ECs cultured in ZM323881 or control conditions and e quantification, N = 2. f Heat map for RT-qPCR results of mRNA expression displayed as ddCT normalized to iECs N = 2. Statistical significance levels are set at *p ≤ 0.05, **p ≤ 0.01, ***p ≤ 0.001, and ****p ≤ 0.0001 by two-tailed Student’s t-test and Tukey’s multiple comparison test. For bar graphs: data are presented as mean ± SD. For box and whisker plots: centerline, median; box limits, upper and lower quartiles; whiskers, minimum to maximum value. Scale bar: 100 μm.
|