|
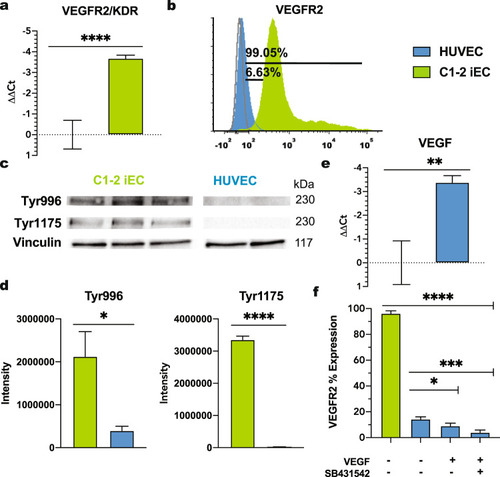
High VEGFR2 expression in iECs.a RT-qPCR data for VEGFR2 normalized to HUVECs. (N = 3; n = 9). b Representative flow cytometry data for VEGFR2 in HUVECs (blue, 6.63%) and C1-2 hiPSC-ECs (green, 99.05%) (N = 3). c Western blot analysis of VEGFR2 phosphorylation at tyrosine 996 and 1175 and d quantification. (N = 3). e RT-qPCR data for VEGF normalized to C1-2. (N = 3, n = 9). f VEGFR2 expression in HUVECs cultured with and without VEGF (50 ng/ml) and the TGFβ inhibitor, SB431542. (N = 3) Statistical significance levels are set at *p ≤ 0.05, **p ≤ 0.01, ***p ≤ 0.001, and ****p ≤ 0.0001 by two-tailed Student’s t-test and Tukey’s multiple comparison test. Data are presented as mean ± SD. Scale bar: 100 μm.
|