|
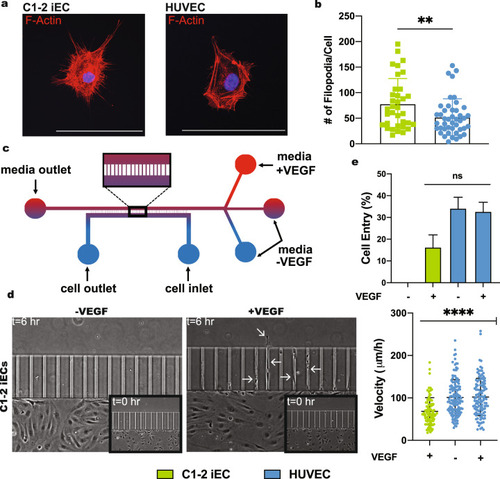
Filopodia formation and VEGF-dependent migration of iECs.a Filopodia formation in C1–2 iECs and HUVECs was assessed using F-actin and Myosin X stain followed by confocal microscopy of dispersed cells. b Quantification of filopodia was analyzed using an F-actin stain with the Image J plug-in FiloQuant. (N = 3, n = 45). Graph plotted without outliers. c Schematic of the microfluidic device with amplification of the 2D cell culture and migration channels region and d image of C1-2 iEC migration in the channels with and without a VEGF gradient at t = 6 h. Arrows indicate iECs migrating through the channels. The boxed images show cells at t = 0. e Quantification of cell entry and velocity in the channel of individual cells (N = 3, n = 105–120). Statistical significance levels are set at *p ≤ 0.05, **p ≤ 0.01, ***p ≤ 0.001, and ****p ≤ 0.0001 by two-tailed Student’s t-test and Tukey’s multiple comparison test. Data are presented as mean ± SD. Scale bar: 100 μm.
|