IMAGE

Fig. 2

ID
ZDB-IMAGE-220517-47
Source
Figures for Macklin et al., 2022
Image
Figure Caption

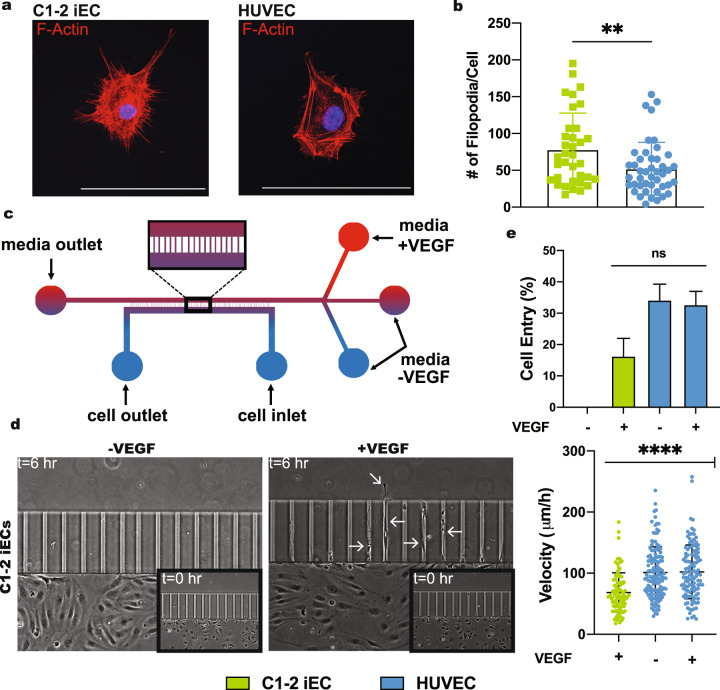
Fig. 2 Filopodia formation and VEGF-dependent migration of iECs.

a Filopodia formation in C1–2 iECs and HUVECs was assessed using F-actin and Myosin X stain followed by confocal microscopy of dispersed cells. b Quantification of filopodia was analyzed using an F-actin stain with the Image J plug-in FiloQuant. (N = 3, n = 45). Graph plotted without outliers. c Schematic of the microfluidic device with amplification of the 2D cell culture and migration channels region and d image of C1-2 iEC migration in the channels with and without a VEGF gradient at t = 6 h. Arrows indicate iECs migrating through the channels. The boxed images show cells at t = 0. e Quantification of cell entry and velocity in the channel of individual cells (N = 3, n = 105–120). Statistical significance levels are set at *p ≤ 0.05, **p ≤ 0.01, ***p ≤ 0.001, and ****p ≤ 0.0001 by two-tailed Student’s t-test and Tukey’s multiple comparison test. Data are presented as mean ± SD. Scale bar: 100 μm.

Acknowledgments
This image is the copyrighted work of the attributed author or publisher, and ZFIN has permission only to display this image to its users. Additional permissions should be obtained from the applicable author or publisher of the image. Full text @ NPJ Regen Med