IMAGE

Fig. 1

ID
ZDB-IMAGE-220517-43
Source
Figures for Macklin et al., 2022
Image
Figure Caption

Fig. 1 iECs display extensive sprouting and a high glycolytic rate.

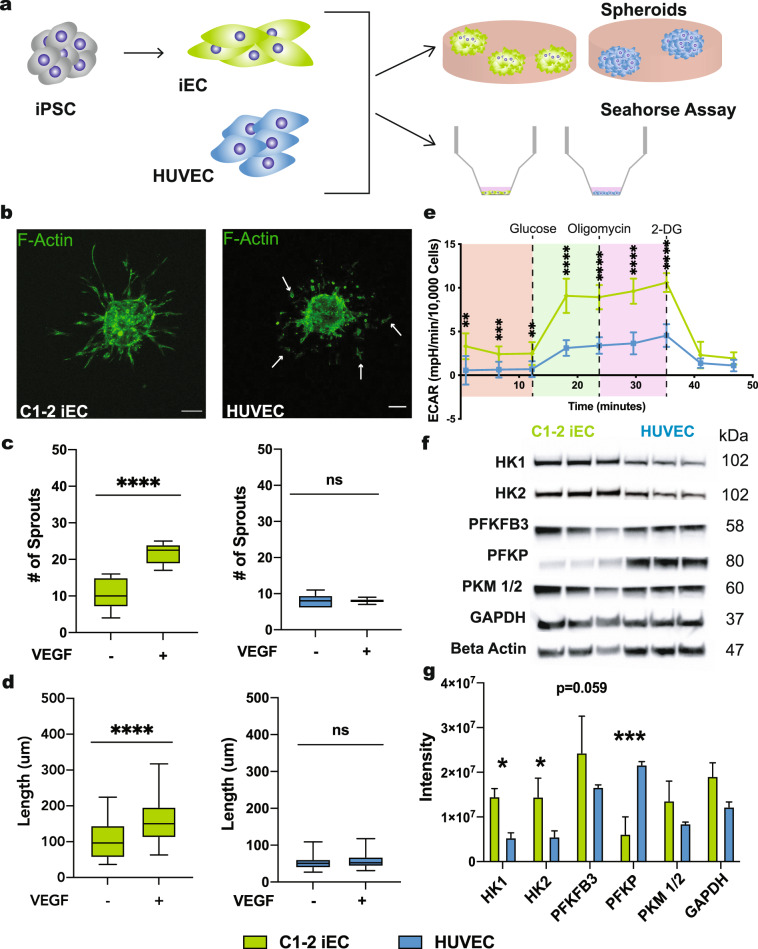
iECs derived from the C1-2 hiPSC line were analyzed for sprouting abilities. a Schematic is outlining the experimental workflow. b Representative confocal images of HUVEC (left) and iEC (right) sprouting spheroids after 24 h in collagen gel in media supplemented with or without VEGF. Arrows indicate disconnected cells. c Quantification of the average number (#) of sprouts per spheroid and d average sprout length (N = 3, n = 25–30). e Extracellular Acidification Rate measured via Seahorse Assay in C1-2 iECs and HUVECs (red, non-glycolytic acidification; green, glycolysis; purple, glycolytic max; N = 3, n = 9). f Western blot analysis of glycolysis enzymes and g quantification, N = 3. Statistical significance levels are set at *p ≤ 0.05, **p ≤ 0.01, ***p ≤ 0.001, and ****p ≤ 0.0001 by two-tailed Student’s t-test and Sidak’s multiple comparison test. For bar graphs: data are presented as mean ± SD. For box and wisker plots: centerline, median; box limits, upper and lower quartiles; wiskers, minimum to maximum value. Scale bar: 100 μm.

Acknowledgments
This image is the copyrighted work of the attributed author or publisher, and ZFIN has permission only to display this image to its users. Additional permissions should be obtained from the applicable author or publisher of the image. Full text @ NPJ Regen Med