
- Title
-
Brain-wide perception of the emotional valence of light is regulated by distinct hypothalamic neurons
- Authors
- Wagle, M., Zarei, M., Lovett-Barron, M., Poston, K.T., Xu, J., Ramey, V., Pollard, K.S., Prober, D.A., Schulkin, J., Deisseroth, K., Guo, S.
- Source
- Full text @ Mol. Psychiatry
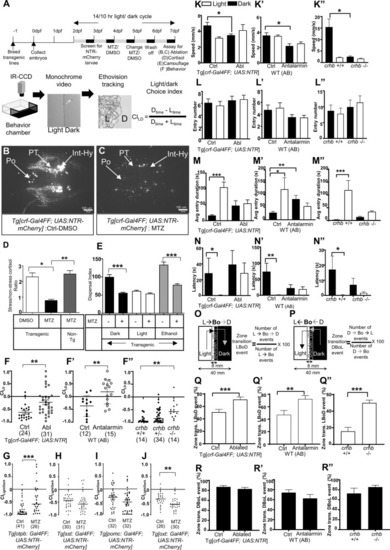
CRFHy neurons promote dark avoidance by regulating multiple behavioral components.
A Schematic of the experimental flow. B, C Images of CRF neurons in transgenic larval zebrafish treated with DMSO (B) and Metronidazole (MTZ) (C). D Ratio of cortisol level (stress/baseline) in control and CRFHy-ablated subjects, Kruskal–Wallis test, Dunn’s multiple comparisons test, n = 6 per group, *p < 0.05, **p < 0.01. E Camouflage response in control and CRFHy -ablated subjects upon light, dark or ethanol treatment. Ordinary one-way ANOVA, Sidak’s multiple comparison test, n = 16 per group, ***p < 0.001. Error bars represent SEM. F–F” Light–dark choice index (CILD) upon CRFHy neuronal ablation (F), CRF receptor 1 antagonist treatment (F’), and in crhb−/− mutants (F”), in comparison to corresponding sibling controls. Note that the behavior is sensitive to genetic backgrounds. G–J CILD of larvae with ablation of otpb-expressing neurons (G), somatostatin neurons (H), pomc pituitary neurons (I), and oxytocin neurons (J), with corresponding sibling control (non-ablated) larvae. For all graphs, normality test was performed to decide gaussian distribution and accordingly Mann–Whitney test for (F, F’, G, H, I), and unpaired t test with Welch’s correction for (J) and ANOVA followed by comparison test was performed (Kruskal–Wallis test and Dunn’s multiple comparisons test) for (F”), was performed, *p < 0.05, **p < 0.01, ***p < 0.001, numbers with parathesis indicate sample size, error bars representing SEM. K–N Kinematics of behavior upon CRFHy ablation, CRF receptor antagonist treatment, or in crhb−/− mutants in comparison to corresponding control siblings; data are shown in light (white bars) and dark zones (black bars). Comparison of swim speed (K–K”), numbers of zone entries (L–L”), time spent in zone upon entry (M–M”), Latency to first zone entry (N–N”). O, P Schematic showing transition at the boundary of light–dark zone for events of crossover to dark zone (Light- > Border- > Dark, O) and crossover to light zone (Dark- > Border- > Light: P) with formula to calculate % zone transition LBoD and DBoL events respectively. Q–Q” Bar graphs showing comparison of percent zone transition events from Light -> Bo- > Dark (LBoD) upon CRFHy ablation (Q), CRF receptor antagonist treatment (Q’) and in crhb−/− mutants (Q”) with respective controls. R–R” Bar graphs showing comparison of percent zone transition events from Dark- > Bo- > Light (DBoL) upon CRFHy ablation (R), CRF receptor antagonist treatment (R’) and in crhb−/− mutants (R”) with respective controls. Sample size is displayed in Panel (F–F”). For all graphs, a normality test was performed to decide gaussian distribution and accordingly Mann–Whitney test (for Q, R, R”), Unpaired t test with Welch’s correction (for Q’, Q” and R’) and ANOVA followed by comparison test was performed (Kruskal–Wallis test and Dunn’s multiple comparisons test for K–K”, L–L”, M–M”, N–N”), *p < 0.05, **p < 0.01, ***p < 0.001, error bars representing SEM. |
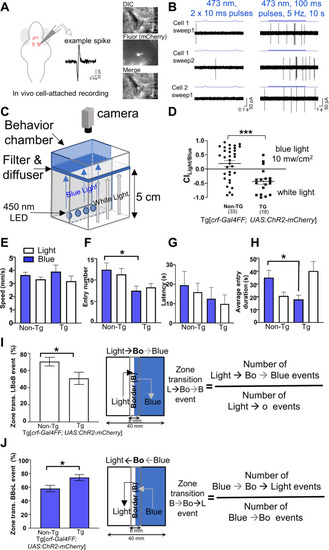
Optogenetic activation of CRFHy neurons promotes avoidance behavior.
A Schematic of in vivo cell-attached recording of CRF neurons expressing ChR2-mcherry. B Recordings from CRF neurons upon stimulation with 473 nm light at 3 mW shows that single pulses do not drive spiking reliably, but prolonged stimulation causes robust spiking. C Schematic of the optogenetic behavior setup. D White vs blue light choice index for transgenic and non-transgenic sibs. E–H Kinematics of choice behavior for white light (white bars) and blue light zones (blue bars), for swim speed (E), entry numbers (F), latency (G), and entry duration (H). I, J Zone transition decision at the boundary of white light-blue light zone: bar graphs showing precent of zone transition events and schematic showing transition along with formula to calculate % zone transition events for cross over to blue zone (Light- > Bo- > Blue, I) and to light zone (Blue- > Bo- > Light, J). For all graphs, normality test was performed to assess gaussian distribution and Mann–Whitney test (for D, I, J), Kruskal–Wallis test and Dunn’s multiple comparisons test (for E–H) were performed. n = 35 (non-TG), 36 (TG),*p < 0.05, ***p < 0.0001, error bars representing SEM. |
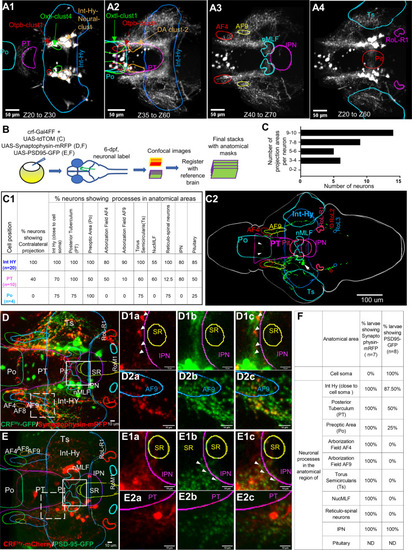
Single neuron projection analyses reveal broad connections of individual CRFHy neurons.
A1–A4 Images of selected z-plane stacks averaged from 10 larval brains (6–7 dpf) registered with the z-brain atlas and overlaid with anatomical masks. CRF neurons are near Otpb-cluster 1 and Oxt-cluster 4 and occupies a position in the Intermediate Hy neural cluster (A1). CRF neurons in preoptic and posterior tuberculum are near oxtl-cluster 1, Otpb-cluster 4 and Dopaminergic neuron cluster 2 (A2). CRF neuronal processes reach arborization fields AF4, AF9, nucleus of medial longitudinal fascicle (nMLF) and inter-peduncular nucleus (IPN) (A3). CRF neuronal processes are detected in the Torus semicicularis (Ts), pituitary (Pit), and reticular spinal motor neurons in Rol1-R1 (A4). B Schematic of single neuron labeling and registration. Similar scheme was followed with injection of UAS:PSD95-GFP or UAS:Synaptophysin-RFP into Tg[CRFHy:GAL4FF] embryos. C–C2 Single neuron labeling and projection analysis. A histogram showing the number of CRF neurons (x-axis) with the number of projection areas (y-axis) analyzed by single neuron labeling (C). Table showing number of CRF neurons imaged in intermediate hypothalamus (Int-Hy), Posterior Tuberculum (PT) and Pre-optic (Po) with their neuronal processes identified in anatomical areas (C1). An example single neuron-labeled stack registered with Z-brain and maximum intensity projection overlaid with anatomical masks. The cell soma is positioned in Int-Hy (pointed by a white arrow) and its processes are detected both ipsi- and contra-laterally, with the crossover to the contralateral side pointed by arrowheads (C2). D Presynaptic labeling of transgenic CRFHy neuronal processes. Maximum intensity projection of z-plane images from CRFHy transgenic larva expressing synaptophysin-mRFP (red) and cytoplasmic GFP, overlaid with Z-brain atlas anatomical mask outlines after registration. D1a–D1c zoomed-in images of solid line square box in (D) created with maximum intensity projection of selected z-plane images, showing neuronal process expressing synaptophysin-mRFP (D1a), GFP (D1b) and overlap (D1c) near IPN; a few synaptophysin-mRFP puncta detected in the region in all subjects. D2a–D2c zoomed-in images of dashed line square box in (D) created with maximum intensity projection of selected z-plane images, showing neuronal process expressing synaptophysin-RFP (D2a), GFP (D2b) and overlap (D2c); synaptophysin puncta was detected in neuronal processes near AF9. E Post-synaptic labeling of transgenic CRFHy neuronal process. Maximum intensity projection of z-plane images from CRFHy transgenic larva expressing PSD95-GFP (green) and cytoplasmic mCherry, overlaid with the anatomical masks after registration. E1a–E1c zoomed-in images of solid line square box in (E) created with maximum intensity projection of selected z-plane images, showing neuronal processes expressing mCherry (E1a), PSD95-GFP (E1b) and overlap (E1c) near IPN. E2a–E2c Zoomed-in images of dashed line square box in (E) created with maximum intensity projection of selected z-plane images, showing neuronal processes expressing mCherry (E2a), PSD95-GFP(E2b) and overlap (E2c); PSD95-GFP puncta was detected in neuronal processes in PT. F Table showing precent larvae with detection of synaptophysin-mRFP and PSD-95-GFP near cell soma and neuronal processes in various projection areas. Abbreviations: Refer to Table S3. EXPRESSION / LABELING:
|
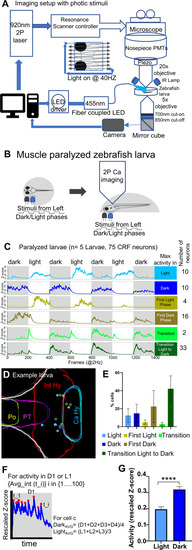
In vivo calcium imaging of CRFHy neuronal activity upon light/dark stimuli.
A Schematic of the setup that enables simultaneous calcium imaging with two-photon resonance scanning microscope and light stimulus delivery. Light stimuli were pulse delivered during the y-flyback of galvo scanner such that the light does not interfere with GCaMP imaging. B Schematic showing neuronal activity imaging in paralyzed and completely embedded larva. The blue LED (455 nm) light was pulsed as visual stimuli in alternate light and dark phases, each lasting 100 seconds. C CRFHy neuronal activity imaged in paralyzed larvae, classified into six classes in correlation with phases of photic stimuli. side bars show activity classes, and corresponding Z-score plots show CRFHy activity for each class, gray and white blocks representing dark and light phases respectively. The number of CRFHy neurons in each photic response class was shown on the right. D Schematic showing the position of CRF neurons as colored circles corresponding to each photic response class in an example larva. E A plot showing the percentage distribution CRFHy neurons among the six photic response classes (n = 5 larvae). F Schematic showing the calculation of activity response in each dark/light phase; (G) the plot showing the average activity of CRFHy neurons in light vs dark, Mann–Whitney test, ****p < 0.0001, n = 75 neurons from 5 larvae, error bars representing SEM. |
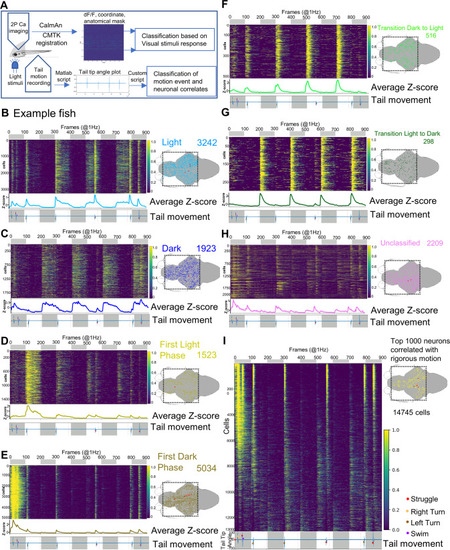
Brain-wide calcium imaging uncovers distributed coding of photic stimuli and motor information.
A Schematic showing the setup and pipeline of brain-wide neural activity data processing. Transgenic larva Tg[HuC:H2B-GcaMP6s;crf:Gal4FF;UAS:GCaMP6s;UAS:NTR-mCherry] is embedded in low melting agarose leaving the tail free. GCaMP imaging, tail movement recording, and light stimulus delivery is similar to the setup described in Fig. 4A. The calcium imaging data are processed through CaImAn and ROI (neuronal nuclei) coordinates from CaImAn analysis were registered to the Z-brain atlas template through CMTK registration. B–H Example of brain-wide activity heatmaps showing seven photic response neuronal types (left) and their distributions in the brain (right). Dotted squares in the 2D brain schematics represent the field of view of imaging; red dots show the position of CRFHy neurons. The number of cells scored in each photic response class is denoted in the top right corner. The top bar shows dark (grey) and light (white) phases. At the bottom of each heatmap plots is average z-score activity plots for corresponding classes along with the tail movement plot showing tail tip angles (y-axis). I Example of brain-wide activity heatmaps arranged in order of correlation with tail moments. The bottom shows the tail movement plot with light and dark phases indicated. On the right is a 2D brain schematic, showing corresponding brain-wide distributions of top 1,000 neurons showing vigorous motion-correlated neuronal activity; red dots show the position of CRFHy neurons. PHENOTYPE:
|
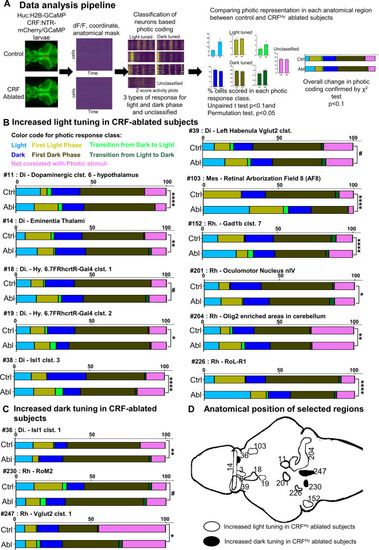
CRFHy neurons decrease the representation of light in a highly selective, distributed set of brain areas.
A Schematic showing the data processing pipeline. Control and CRFHy-ablated Tg[HuC:H2B-GcaMP6s, crf:Gal4FF;UAS:GCaMP6s,UAS:NTR-mCherry] larvae were subjected to brain-wide calcium imaging as described in Fig. 5A. The data processing yields the information of each neuron’s activity (dff), coordinates and anatomical regions (mask) it belongs to. Neurons were classified based on their max activity with respect to light and dark phases. For each anatomical region, the percent of cells in each photic class were scored and compared between control and CRFHy-ablated subjects. Anatomical regions showing significant difference in at least one of the photic classes were selected. The comparison of overall distribution of cells in all photic classes in the significant anatomical regions was further carried out with χ2 test. B Color codes are used to represent each photic class. Bar graphs showing comparison of proportion of cells belonging to each photic response class in control vs CRFHy-ablated subjects. Increased tuning to the light was observed in CRFHy-ablated subjects for 11 brain areas, with ID number 14, 39, 103, 226 having a significant increase of “light” response type, ID number 11, 18, 201, 204 having significant increase of “First light” response type, ID number 152 having a shift from First light to light response type, whereas ID number 19 and 38 having a significant decrease in “dark” response type. C Bar graphs for anatomical regions showing increased tuning to dark in the CRFHy-ablated subjects. Anatomical region with ID 36 showed a significant increase in “dark” response type whereas anatomical region with ID 230 and 247 showed a significant increase in “First dark” response type. For (B) and (C) χ2 test, #p < 0.1, *p < 0.05, **p < 0.01, ***p < 0.001, ****p < 0.0001, n = 10 larvae per group. D Schematic showing the position of anatomical regions presented in (B) and (C). The anatomical mask outlines are shown unilaterally (except for #14 and #39). PHENOTYPE:
|
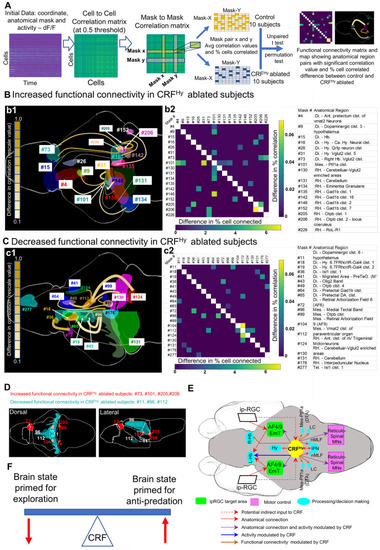
CRFHy neurons regulate functional connectivity of selective and distributed brain areas.
A Flow chart showing steps in functional connectivity analysis to identify pairs of anatomical regions showing significant difference between control and CRFHy-ablated subjects. The data carrying activity (dF/F) and anatomical region information for each neuron was used to derive cell to cell correlation matrix with correlation value 0.5 as threshold and the correlation matrix between anatomical regions referred as mask-to-mask correlation matrix. For each anatomical region pair (mask to mask pair) average correlation value and percent cells pairs in correlation were calculated. Comparison of control and CRFHy ablated (n = 10 for each group) was carried out. Mask to mask pair that showed significant increase or decrease in connectivity (both correlation value and percent of significantly correlated cell pairs) were selected to create functional connectivity matrix and to draw the functional connectivity map showing the effect of CRFHy ablation. B, C Schematic diagram showing the brain regions with significantly increased (B1) or decreased (C1) functional connectivity in CRFHy-ablated subjects. The color of connecting line represents the rescaled difference in correlation value and the thickness of line represents the rescaled difference in percent of correlated cell pairs. A matrix showing difference in correlation value (right- top) and difference in percent of cells correlated (left -bottom) (B2,C2). The table showing the description for anatomic region ID numbers in B1-B2 and C1-C2. D Schematic model describing the circuit controlling the dark avoidance behavior based on the anatomical analysis, comparison of photic response and functional connectivity between control vs CRFHy-ablated subjects. E Schematic diagram showing dorsal and lateral views of brain regions that showed significantly increased (red) or decreased (cyan) functional connectivity with at least two other brain regions. F Schematic model showing CRF acts as a modulator of the brain state primed for exploration vs anti-predation. |