
|
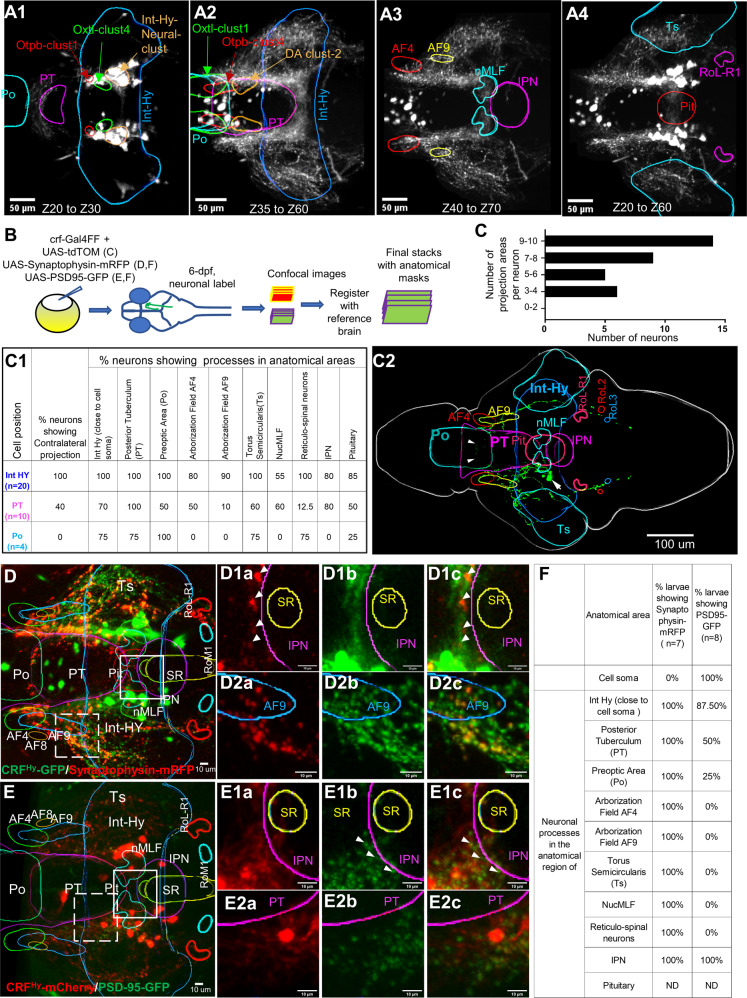
Fig. 3
A1–A4 Images of selected z-plane stacks averaged from 10 larval brains (6–7 dpf) registered with the z-brain atlas and overlaid with anatomical masks. CRF neurons are near Otpb-cluster 1 and Oxt-cluster 4 and occupies a position in the Intermediate Hy neural cluster (A1). CRF neurons in preoptic and posterior tuberculum are near oxtl-cluster 1, Otpb-cluster 4 and Dopaminergic neuron cluster 2 (A2). CRF neuronal processes reach arborization fields AF4, AF9, nucleus of medial longitudinal fascicle (nMLF) and inter-peduncular nucleus (IPN) (A3). CRF neuronal processes are detected in the Torus semicicularis (Ts), pituitary (Pit), and reticular spinal motor neurons in Rol1-R1 (A4). B Schematic of single neuron labeling and registration. Similar scheme was followed with injection of UAS:PSD95-GFP or UAS:Synaptophysin-RFP into Tg[CRFHy:GAL4FF] embryos. C–C2 Single neuron labeling and projection analysis. A histogram showing the number of CRF neurons (x-axis) with the number of projection areas (y-axis) analyzed by single neuron labeling (C). Table showing number of CRF neurons imaged in intermediate hypothalamus (Int-Hy), Posterior Tuberculum (PT) and Pre-optic (Po) with their neuronal processes identified in anatomical areas (C1). An example single neuron-labeled stack registered with Z-brain and maximum intensity projection overlaid with anatomical masks. The cell soma is positioned in Int-Hy (pointed by a white arrow) and its processes are detected both ipsi- and contra-laterally, with the crossover to the contralateral side pointed by arrowheads (C2). D Presynaptic labeling of transgenic CRFHy neuronal processes. Maximum intensity projection of z-plane images from CRFHy transgenic larva expressing synaptophysin-mRFP (red) and cytoplasmic GFP, overlaid with Z-brain atlas anatomical mask outlines after registration. D1a–D1c zoomed-in images of solid line square box in (D) created with maximum intensity projection of selected z-plane images, showing neuronal process expressing synaptophysin-mRFP (D1a), GFP (D1b) and overlap (D1c) near IPN; a few synaptophysin-mRFP puncta detected in the region in all subjects. D2a–D2c zoomed-in images of dashed line square box in (D) created with maximum intensity projection of selected z-plane images, showing neuronal process expressing synaptophysin-RFP (D2a), GFP (D2b) and overlap (D2c); synaptophysin puncta was detected in neuronal processes near AF9. E Post-synaptic labeling of transgenic CRFHy neuronal process. Maximum intensity projection of z-plane images from CRFHy transgenic larva expressing PSD95-GFP (green) and cytoplasmic mCherry, overlaid with the anatomical masks after registration. E1a–E1c zoomed-in images of solid line square box in (E) created with maximum intensity projection of selected z-plane images, showing neuronal processes expressing mCherry (E1a), PSD95-GFP (E1b) and overlap (E1c) near IPN. E2a–E2c Zoomed-in images of dashed line square box in (E) created with maximum intensity projection of selected z-plane images, showing neuronal processes expressing mCherry (E2a), PSD95-GFP(E2b) and overlap (E2c); PSD95-GFP puncta was detected in neuronal processes in PT. F Table showing precent larvae with detection of synaptophysin-mRFP and PSD-95-GFP near cell soma and neuronal processes in various projection areas. Abbreviations: Refer to Table S3.