
|
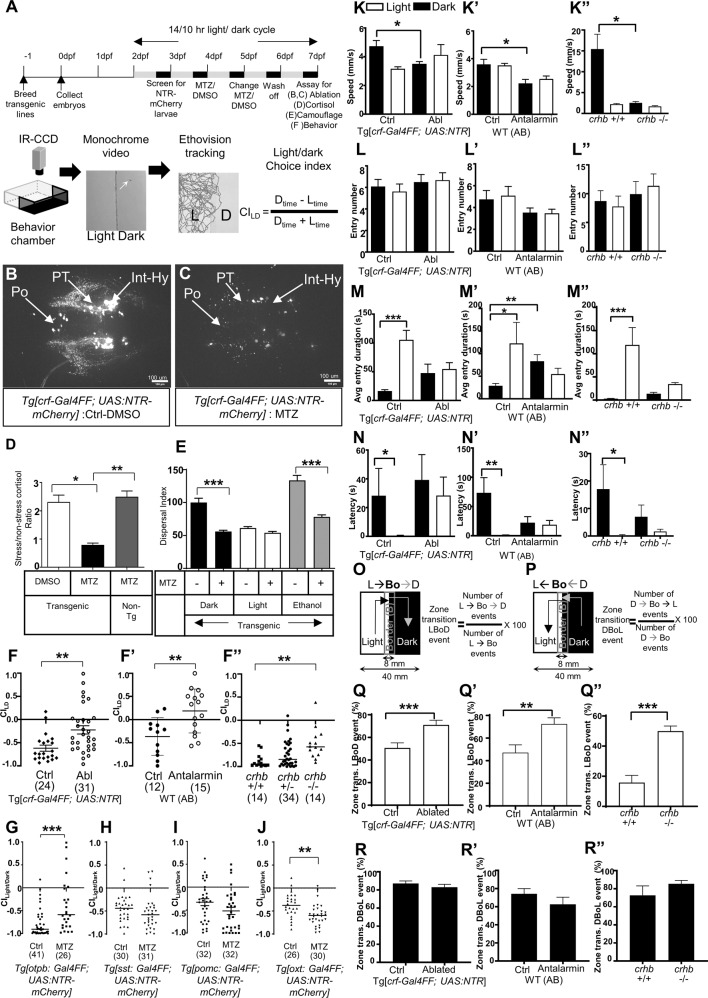
Fig. 1
A Schematic of the experimental flow. B, C Images of CRF neurons in transgenic larval zebrafish treated with DMSO (B) and Metronidazole (MTZ) (C). D Ratio of cortisol level (stress/baseline) in control and CRFHy-ablated subjects, Kruskal–Wallis test, Dunn’s multiple comparisons test, n = 6 per group, *p < 0.05, **p < 0.01. E Camouflage response in control and CRFHy -ablated subjects upon light, dark or ethanol treatment. Ordinary one-way ANOVA, Sidak’s multiple comparison test, n = 16 per group, ***p < 0.001. Error bars represent SEM. F–F” Light–dark choice index (CILD) upon CRFHy neuronal ablation (F), CRF receptor 1 antagonist treatment (F’), and in crhb−/− mutants (F”), in comparison to corresponding sibling controls. Note that the behavior is sensitive to genetic backgrounds. G–J CILD of larvae with ablation of otpb-expressing neurons (G), somatostatin neurons (H), pomc pituitary neurons (I), and oxytocin neurons (J), with corresponding sibling control (non-ablated) larvae. For all graphs, normality test was performed to decide gaussian distribution and accordingly Mann–Whitney test for (F, F’, G, H, I), and unpaired t test with Welch’s correction for (J) and ANOVA followed by comparison test was performed (Kruskal–Wallis test and Dunn’s multiple comparisons test) for (F”), was performed, *p < 0.05, **p < 0.01, ***p < 0.001, numbers with parathesis indicate sample size, error bars representing SEM. K–N Kinematics of behavior upon CRFHy ablation, CRF receptor antagonist treatment, or in crhb−/− mutants in comparison to corresponding control siblings; data are shown in light (white bars) and dark zones (black bars). Comparison of swim speed (K–K”), numbers of zone entries (L–L”), time spent in zone upon entry (M–M”), Latency to first zone entry (N–N”). O, P Schematic showing transition at the boundary of light–dark zone for events of crossover to dark zone (Light- > Border- > Dark, O) and crossover to light zone (Dark- > Border- > Light: P) with formula to calculate % zone transition LBoD and DBoL events respectively. Q–Q” Bar graphs showing comparison of percent zone transition events from Light -> Bo- > Dark (LBoD) upon CRFHy ablation (Q), CRF receptor antagonist treatment (Q’) and in crhb−/− mutants (Q”) with respective controls. R–R” Bar graphs showing comparison of percent zone transition events from Dark- > Bo- > Light (DBoL) upon CRFHy ablation (R), CRF receptor antagonist treatment (R’) and in crhb−/− mutants (R”) with respective controls. Sample size is displayed in Panel (F–F”). For all graphs, a normality test was performed to decide gaussian distribution and accordingly Mann–Whitney test (for Q, R, R”), Unpaired t test with Welch’s correction (for Q’, Q” and R’) and ANOVA followed by comparison test was performed (Kruskal–Wallis test and Dunn’s multiple comparisons test for K–K”, L–L”, M–M”, N–N”), *p < 0.05, **p < 0.01, ***p < 0.001, error bars representing SEM.