
|
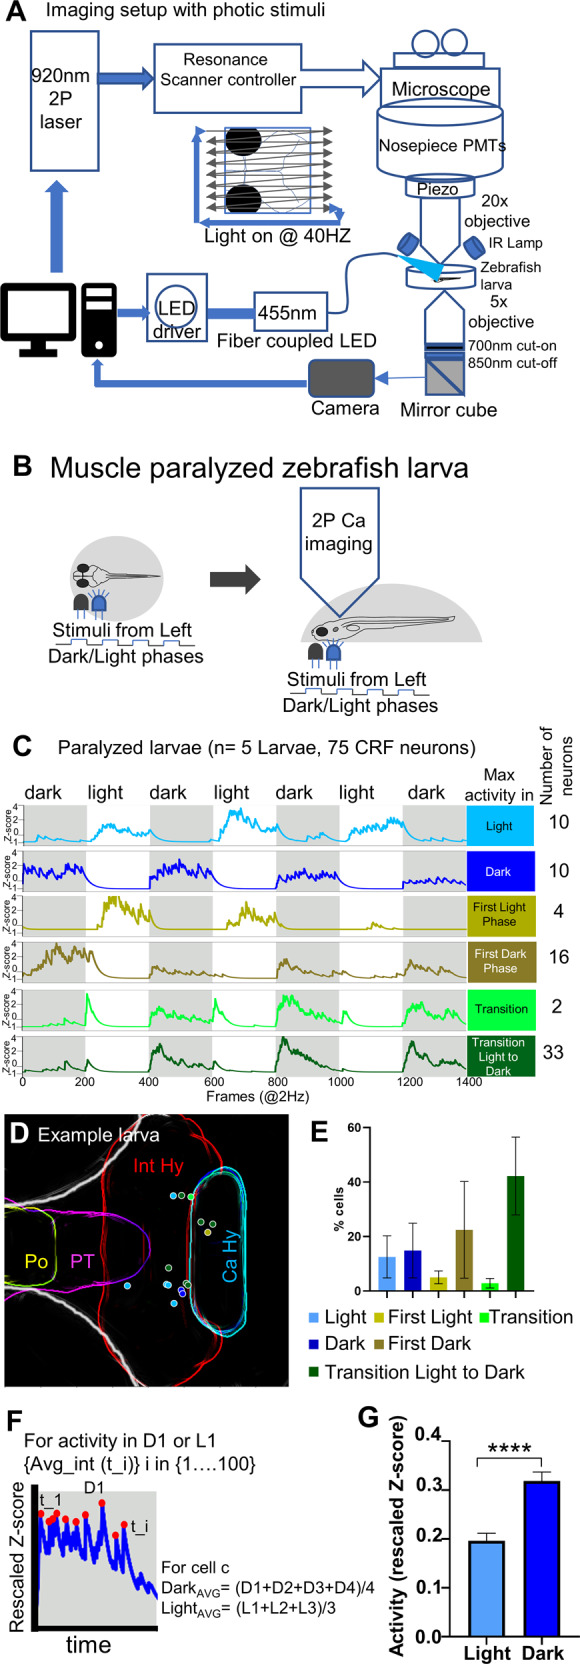
Fig. 4
A Schematic of the setup that enables simultaneous calcium imaging with two-photon resonance scanning microscope and light stimulus delivery. Light stimuli were pulse delivered during the y-flyback of galvo scanner such that the light does not interfere with GCaMP imaging. B Schematic showing neuronal activity imaging in paralyzed and completely embedded larva. The blue LED (455 nm) light was pulsed as visual stimuli in alternate light and dark phases, each lasting 100 seconds. C CRFHy neuronal activity imaged in paralyzed larvae, classified into six classes in correlation with phases of photic stimuli. side bars show activity classes, and corresponding Z-score plots show CRFHy activity for each class, gray and white blocks representing dark and light phases respectively. The number of CRFHy neurons in each photic response class was shown on the right. D Schematic showing the position of CRF neurons as colored circles corresponding to each photic response class in an example larva. E A plot showing the percentage distribution CRFHy neurons among the six photic response classes (n = 5 larvae). F Schematic showing the calculation of activity response in each dark/light phase; (G) the plot showing the average activity of CRFHy neurons in light vs dark, Mann–Whitney test, ****p < 0.0001, n = 75 neurons from 5 larvae, error bars representing SEM.