
Fig. 5
- ID
- ZDB-IMAGE-221201-5
- Publication
- Wagle et al., 2022 - Brain-wide perception of the emotional valence of light is regulated by distinct hypothalamic neurons
- All Figures
- Figures for Wagle et al., 2022
|
Fig. 5
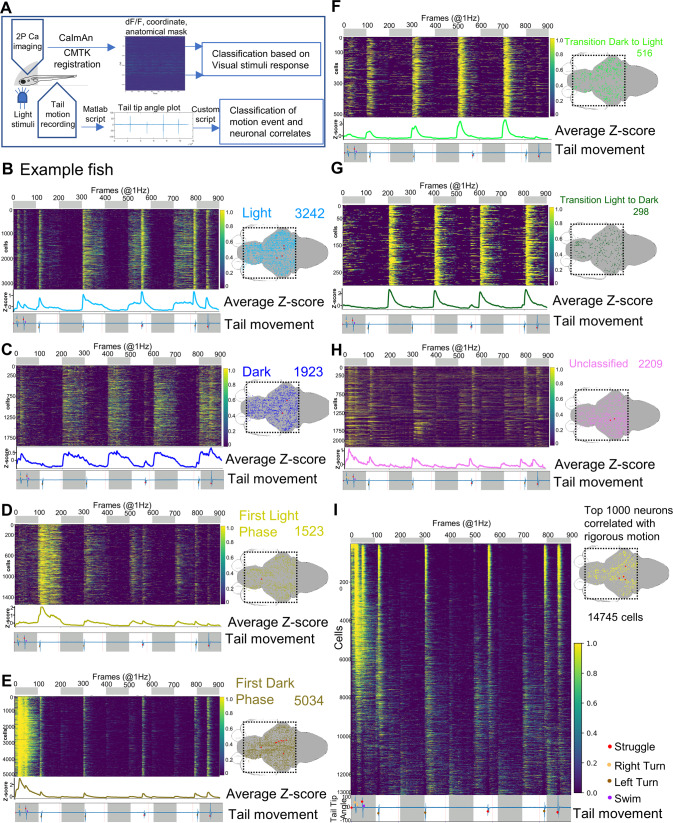
A Schematic showing the setup and pipeline of brain-wide neural activity data processing. Transgenic larva Tg[HuC:H2B-GcaMP6s;crf:Gal4FF;UAS:GCaMP6s;UAS:NTR-mCherry] is embedded in low melting agarose leaving the tail free. GCaMP imaging, tail movement recording, and light stimulus delivery is similar to the setup described in Fig. 4A. The calcium imaging data are processed through CaImAn and ROI (neuronal nuclei) coordinates from CaImAn analysis were registered to the Z-brain atlas template through CMTK registration. B–H Example of brain-wide activity heatmaps showing seven photic response neuronal types (left) and their distributions in the brain (right). Dotted squares in the 2D brain schematics represent the field of view of imaging; red dots show the position of CRFHy neurons. The number of cells scored in each photic response class is denoted in the top right corner. The top bar shows dark (grey) and light (white) phases. At the bottom of each heatmap plots is average z-score activity plots for corresponding classes along with the tail movement plot showing tail tip angles (y-axis). I Example of brain-wide activity heatmaps arranged in order of correlation with tail moments. The bottom shows the tail movement plot with light and dark phases indicated. On the right is a 2D brain schematic, showing corresponding brain-wide distributions of top 1,000 neurons showing vigorous motion-correlated neuronal activity; red dots show the position of CRFHy neurons.