
Fig. 7
- ID
- ZDB-FIG-221201-8
- Publication
- Wagle et al., 2022 - Brain-wide perception of the emotional valence of light is regulated by distinct hypothalamic neurons
- Other Figures
- All Figure Page
- Back to All Figure Page
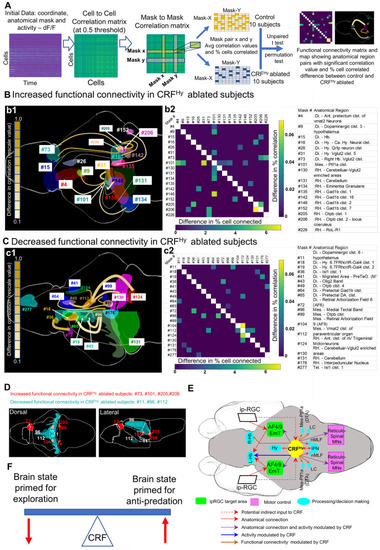
CRFHy neurons regulate functional connectivity of selective and distributed brain areas.
A Flow chart showing steps in functional connectivity analysis to identify pairs of anatomical regions showing significant difference between control and CRFHy-ablated subjects. The data carrying activity (dF/F) and anatomical region information for each neuron was used to derive cell to cell correlation matrix with correlation value 0.5 as threshold and the correlation matrix between anatomical regions referred as mask-to-mask correlation matrix. For each anatomical region pair (mask to mask pair) average correlation value and percent cells pairs in correlation were calculated. Comparison of control and CRFHy ablated (n = 10 for each group) was carried out. Mask to mask pair that showed significant increase or decrease in connectivity (both correlation value and percent of significantly correlated cell pairs) were selected to create functional connectivity matrix and to draw the functional connectivity map showing the effect of CRFHy ablation. B, C Schematic diagram showing the brain regions with significantly increased (B1) or decreased (C1) functional connectivity in CRFHy-ablated subjects. The color of connecting line represents the rescaled difference in correlation value and the thickness of line represents the rescaled difference in percent of correlated cell pairs. A matrix showing difference in correlation value (right- top) and difference in percent of cells correlated (left -bottom) (B2,C2). The table showing the description for anatomic region ID numbers in B1-B2 and C1-C2. D Schematic model describing the circuit controlling the dark avoidance behavior based on the anatomical analysis, comparison of photic response and functional connectivity between control vs CRFHy-ablated subjects. E Schematic diagram showing dorsal and lateral views of brain regions that showed significantly increased (red) or decreased (cyan) functional connectivity with at least two other brain regions. F Schematic model showing CRF acts as a modulator of the brain state primed for exploration vs anti-predation. |
| Fish: | |
|---|---|
| Condition: | |
| Observed In: | |
| Stage: | Day 6 |