
Fig. 6
- ID
- ZDB-FIG-221201-7
- Publication
- Wagle et al., 2022 - Brain-wide perception of the emotional valence of light is regulated by distinct hypothalamic neurons
- Other Figures
- All Figure Page
- Back to All Figure Page
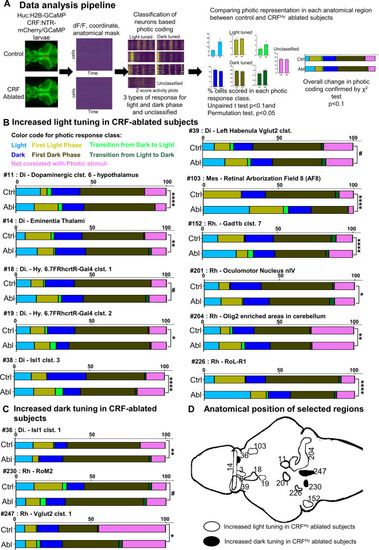
CRFHy neurons decrease the representation of light in a highly selective, distributed set of brain areas.
A Schematic showing the data processing pipeline. Control and CRFHy-ablated Tg[HuC:H2B-GcaMP6s, crf:Gal4FF;UAS:GCaMP6s,UAS:NTR-mCherry] larvae were subjected to brain-wide calcium imaging as described in Fig. 5A. The data processing yields the information of each neuron’s activity (dff), coordinates and anatomical regions (mask) it belongs to. Neurons were classified based on their max activity with respect to light and dark phases. For each anatomical region, the percent of cells in each photic class were scored and compared between control and CRFHy-ablated subjects. Anatomical regions showing significant difference in at least one of the photic classes were selected. The comparison of overall distribution of cells in all photic classes in the significant anatomical regions was further carried out with χ2 test. B Color codes are used to represent each photic class. Bar graphs showing comparison of proportion of cells belonging to each photic response class in control vs CRFHy-ablated subjects. Increased tuning to the light was observed in CRFHy-ablated subjects for 11 brain areas, with ID number 14, 39, 103, 226 having a significant increase of “light” response type, ID number 11, 18, 201, 204 having significant increase of “First light” response type, ID number 152 having a shift from First light to light response type, whereas ID number 19 and 38 having a significant decrease in “dark” response type. C Bar graphs for anatomical regions showing increased tuning to dark in the CRFHy-ablated subjects. Anatomical region with ID 36 showed a significant increase in “dark” response type whereas anatomical region with ID 230 and 247 showed a significant increase in “First dark” response type. For (B) and (C) χ2 test, #p < 0.1, *p < 0.05, **p < 0.01, ***p < 0.001, ****p < 0.0001, n = 10 larvae per group. D Schematic showing the position of anatomical regions presented in (B) and (C). The anatomical mask outlines are shown unilaterally (except for #14 and #39). |
| Fish: | |
|---|---|
| Condition: | |
| Observed In: | |
| Stage: | Day 6 |