
- Title
-
Systematic Roadmap for Cancer Drug Screening Using Zebrafish Embryo Xenograft Cancer Models: Melanoma Cell Line as a Case Study
- Authors
- Letrado, P., Mole, H., Montoya, M., Palacios, I., Barriuso, J., Hurlstone, A., Díez-Martínez, R., Oyarzabal, J.
- Source
- Full text @ Cancers
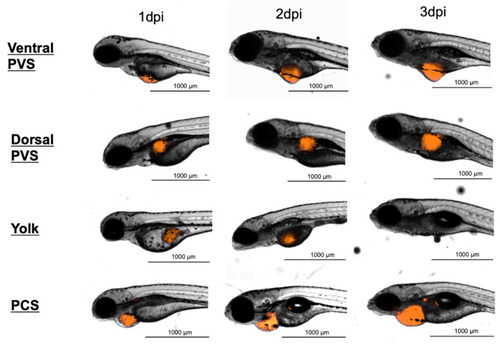
Representative serial images at three time points of zebrafish embryos transplanted at 2-day-old with approximately 1000 888mel mCherry cells at different injection sites. dpi, days post-injection; PVS, perivitelline space; PCS, pericardial space. |
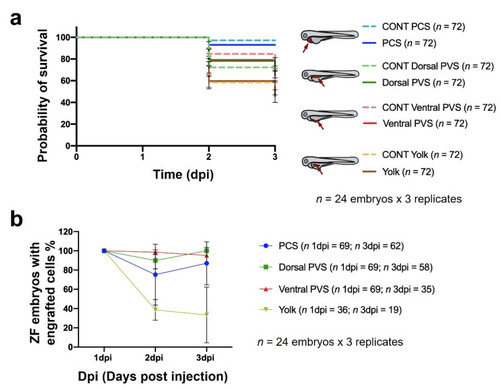
Impacts of different sites of cell implantation on embryo survival (a) and the percentage of zebrafish embryos containing engrafted 888mel mCherry cells. (b) Controls (CONT) refer to embryos microinjected with only the vehicle in which cells were diluted for microinjection (PBS + 2% PVP 60). The data are represented by Kaplan–Meier survival curves, and the results of statistical analyses for (a) are detailed in Table S5. Only zebrafish exhibiting a higher TA at 1 dpi than a pre-defined threshold were included in the analysis. Embryos were considered to present engrafted cells when the TA at 3 dpi was ≥ than the TA at 1 dpi. Results of the statistical analyses for (b) are shown in Tables S6. |
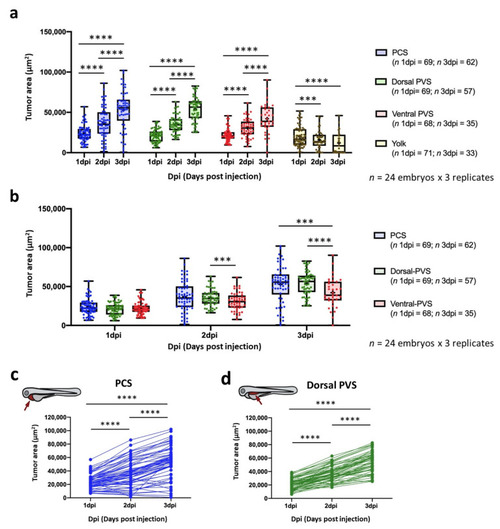
Impact of site of cell implantation on tumor area ascertained by imaging. (a) Comparison of the tumor areas of engrafted embryos at three time points grouped by the sites of injection. (b) Comparison of the tumor areas of engrafted embryos microinjected into different injection sites grouped by time points. Data are presented as box-leaf plots, where the box indicates IQR, line the median value and leafs the 5–95 percentile range. (c) Change in tumor area tracked for individual embryos implanted into the PCS and dorsal PVS. Only zebrafish possessing a tumor area higher than a pre-defined threshold were considered for the analysis (Table S2). Each dot represents an individual embryo. The experiment was designed as a balanced incomplete block assay. Mixed factorial ANOVA was performed with the anovalator STATA command (*** = p-value < 0.001; **** = p-value < 0.0001). |
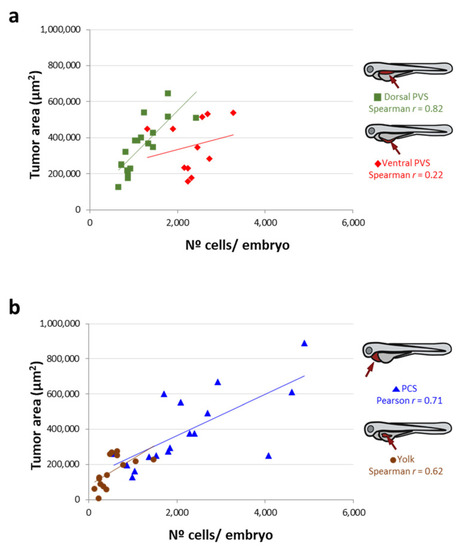
Correlation between the tumor area measured by imaging and the n° of cells/embryo quantified by qPCR (after an inverse interpolation using standard curves) according to each site of injection. ( |
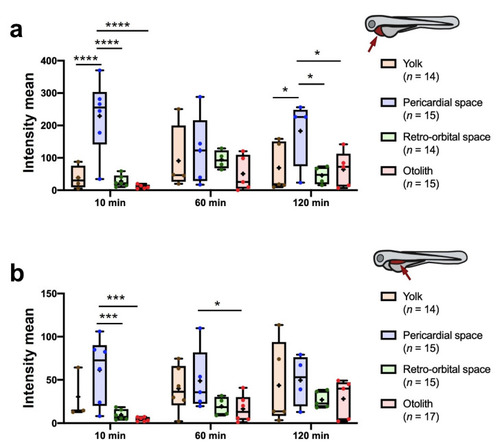
Quantitation of fluorescence intensity in the PCS ( |
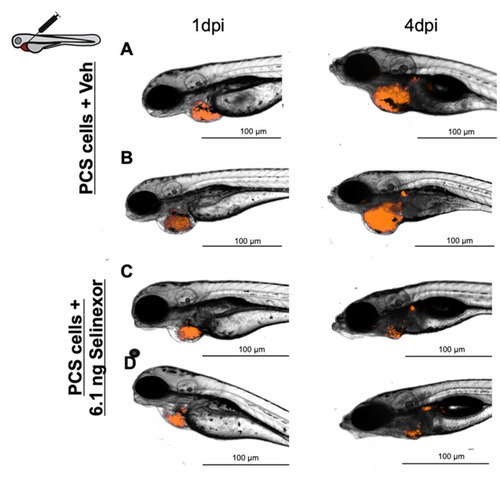
Representative images of embryos engrafted with ~1000 888mel mCherry cells into the PCS and administered 6.1 ng Selinexor by intratumoral injection (A,B) or vehicle (56.25% DMSO + 10% Tween 20 + saline solution) (C,D). |
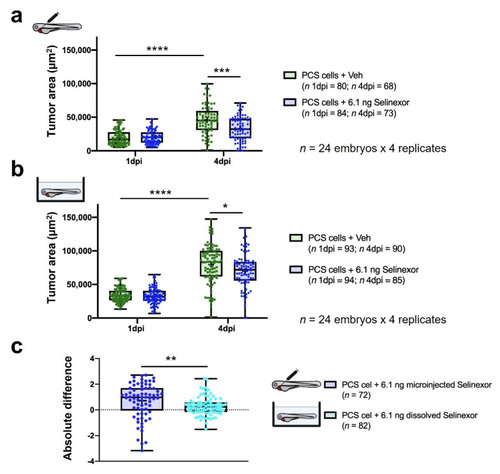
In vivo efficacy of 6.1 ng of selinexor against PCS xenografts comprising 888mel mCherry cells contrasting direct intratumoral injection vs. immersion. (a) Tumor areas (TA) of engrafted embryos treated with selinexor or vehicle (56.25% DMSO + 10% Tween 20 + saline solution) administered by intratumoral microinjection. (b) As (a) but treated with selinexor or vehicle (E3 medium + 0.014% DMSO) administered by immersion. (c) Absolute difference in the efficacy of 6.1 ng of selinexor administered by intratumoral injection or immersion between treatment and control groups determined for embryos that survived until 4 dpi. Only zebrafish that showed a tumor area higher than a pre-defined threshold were considered for the analyses. Data are presented as box-leaf plots, where the box indicates IQR, line the median value and leafs the 5–95 percentile range. Each dot represents an individual embryo. To determine significance, an unpaired t-test or the Wilcoxon matched-pairs signed rank test was performed. For absolute differences, data were analyzed by a Mann–Whitney test. (* = p-value < 0.05; ** = p-value < 0.01; *** = p-value < 0.001; **** = p-value < 0.0001). |
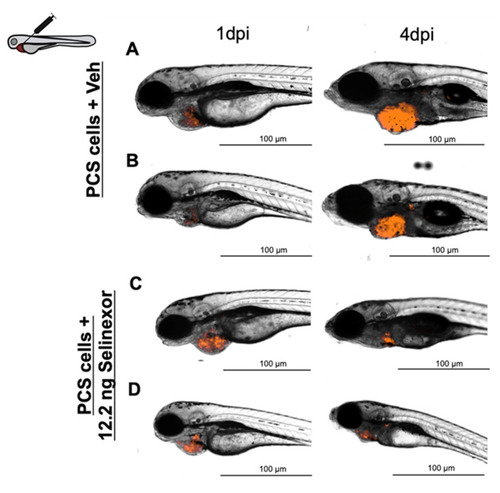
Representative images of embryos engrafted with ~1000 888mel mCherry cells into the PCS and administered 12.2 ng Selinexor by intratumoral injection ( |
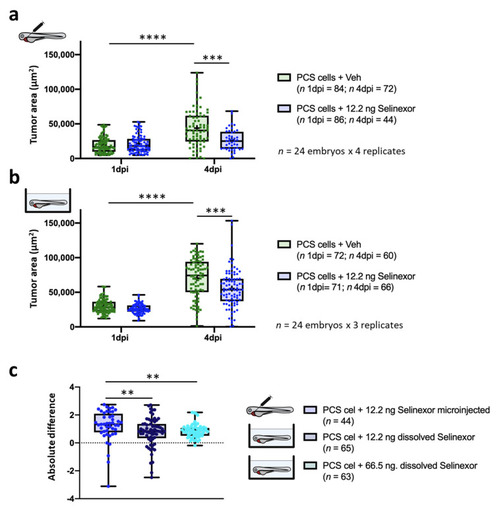
In vivo efficacy of 12.2 ng of selinexor against PCS xenografts comprising 888mel mCherry cells contrasting direct intratumoral injection vs. immersion. (a) Tumor areas (TA) of engrafted embryos treated with selinexor or vehicle (67.5% DMSO + 10% Tween 20 + saline solution) administered by intratumoral microinjection. (b) As (a) but treated with selinexor or vehicle (E3 medium + 0.01% DMSO) administered by immersion. (c) Absolute difference in the efficacy of 12.2 ng of selinexor administered by intratumoral injection or immersion and of 66.5 ng of selinexor in solution between treatment and control groups determined for embryos that survived until 4 dpi. Only zebrafish that showed a tumor area higher than a pre-defined threshold were considered for the analyses. Data are presented as box-leaf plots, where the box indicates IQR, line the median value and leafs the 5–95 percentile range. Each dot represents an individual embryo. To determine significance, a Mann–Whitney test, paired t-test or Wilcoxon matched-pairs signed rank test was performed. For absolute differences, data were analysed by a Kruskal–Wallis test with Dunn’s multiple comparisons test (** = p-value < 0.01; *** = p-value < 0.001; **** = p-value < 0.0001). |
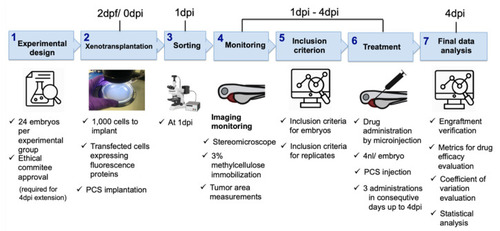
Systematic roadmap for establishing zebrafish embryo xenotransplantation drug efficacy assays. |