
FIGURE
Figure 4
- ID
- ZDB-FIG-210810-36
- Publication
- Letrado et al., 2021 - Systematic Roadmap for Cancer Drug Screening Using Zebrafish Embryo Xenograft Cancer Models: Melanoma Cell Line as a Case Study
- Other Figures
- All Figure Page
- Back to All Figure Page
Figure 4
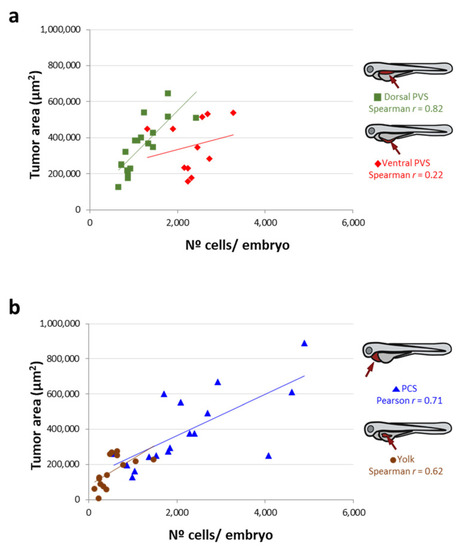
Correlation between the tumor area measured by imaging and the n° of cells/embryo quantified by qPCR (after an inverse interpolation using standard curves) according to each site of injection. ( |
Expression Data
Expression Detail
Antibody Labeling
Phenotype Data
Phenotype Detail
Acknowledgments
This image is the copyrighted work of the attributed author or publisher, and
ZFIN has permission only to display this image to its users.
Additional permissions should be obtained from the applicable author or publisher of the image.
Full text @ Cancers