
Figure 9
- ID
- ZDB-FIG-210810-41
- Publication
- Letrado et al., 2021 - Systematic Roadmap for Cancer Drug Screening Using Zebrafish Embryo Xenograft Cancer Models: Melanoma Cell Line as a Case Study
- Other Figures
- All Figure Page
- Back to All Figure Page
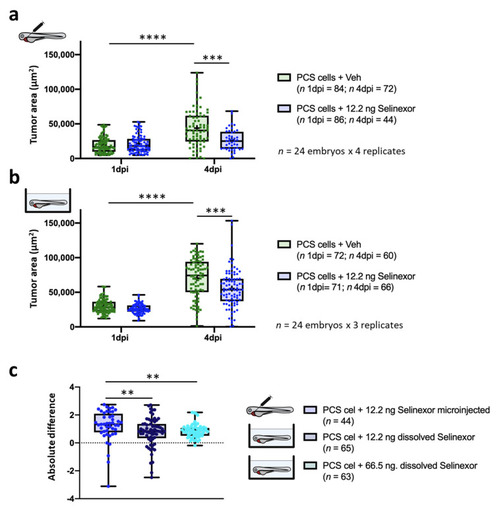
In vivo efficacy of 12.2 ng of selinexor against PCS xenografts comprising 888mel mCherry cells contrasting direct intratumoral injection vs. immersion. (a) Tumor areas (TA) of engrafted embryos treated with selinexor or vehicle (67.5% DMSO + 10% Tween 20 + saline solution) administered by intratumoral microinjection. (b) As (a) but treated with selinexor or vehicle (E3 medium + 0.01% DMSO) administered by immersion. (c) Absolute difference in the efficacy of 12.2 ng of selinexor administered by intratumoral injection or immersion and of 66.5 ng of selinexor in solution between treatment and control groups determined for embryos that survived until 4 dpi. Only zebrafish that showed a tumor area higher than a pre-defined threshold were considered for the analyses. Data are presented as box-leaf plots, where the box indicates IQR, line the median value and leafs the 5–95 percentile range. Each dot represents an individual embryo. To determine significance, a Mann–Whitney test, paired t-test or Wilcoxon matched-pairs signed rank test was performed. For absolute differences, data were analysed by a Kruskal–Wallis test with Dunn’s multiple comparisons test (** = p-value < 0.01; *** = p-value < 0.001; **** = p-value < 0.0001). |