
Image
|
Figure Caption
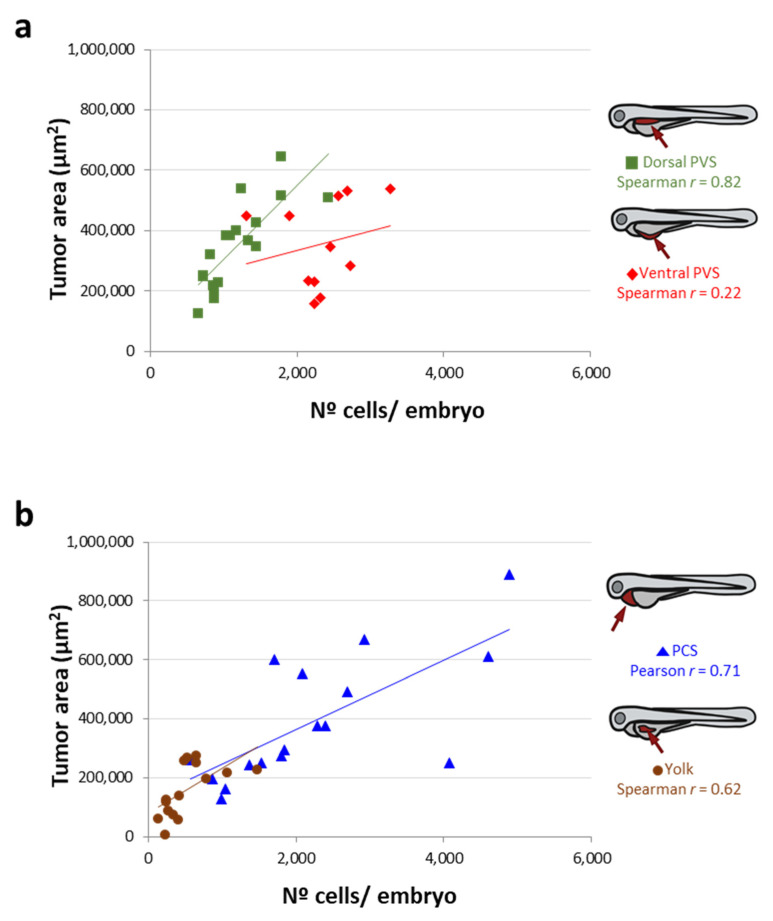
Figure 4
Correlation between the tumor area measured by imaging and the n° of cells/embryo quantified by qPCR (after an inverse interpolation using standard curves) according to each site of injection. (
Acknowledgments
This image is the copyrighted work of the attributed author or publisher, and
ZFIN has permission only to display this image to its users.
Additional permissions should be obtained from the applicable author or publisher of the image.
Full text @ Cancers