IMAGE

Figure 5

ID
ZDB-IMAGE-210810-37
Source
Figures for Letrado et al., 2021
Image
Figure Caption

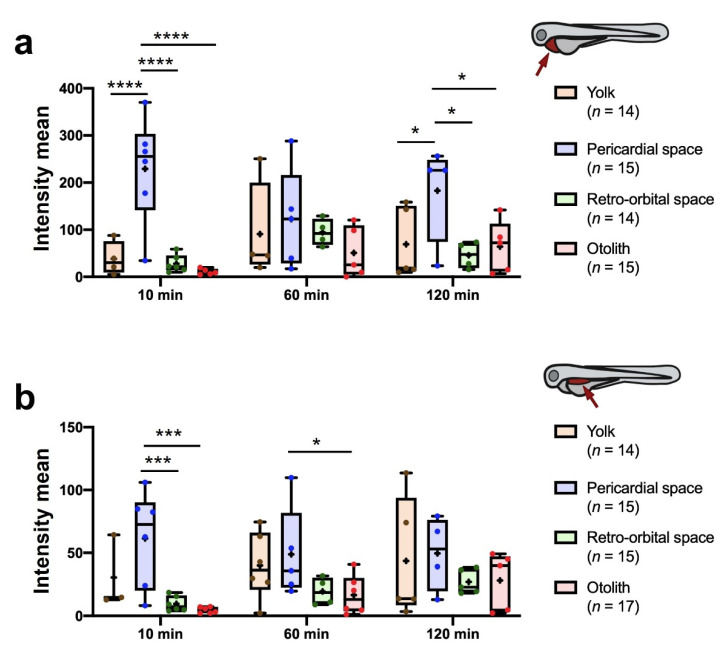
Figure 5

Quantitation of fluorescence intensity in the PCS (a) and dorsal PVS (b) at time points following inoculation of 4 nL of 10 mg/mL Alexa Fluor 488 dextran at the indicated sites (see supplementary methods for calculation of the relative intensity). Data are presented as box-leaf plots, where the box indicates IQR, line the median value and leafs the 5–95 percentile range. Statistical analysis was performed by 3 × 4 factorial ANOVA followed by multiple comparisons (* = p-value < 0.05; *** = p-value < 0.001; **** = p-value < 0.0001).

Acknowledgments
This image is the copyrighted work of the attributed author or publisher, and ZFIN has permission only to display this image to its users. Additional permissions should be obtained from the applicable author or publisher of the image. Full text @ Cancers