
Figure 2
- ID
- ZDB-IMAGE-210810-34
- Publication
- Letrado et al., 2021 - Systematic Roadmap for Cancer Drug Screening Using Zebrafish Embryo Xenograft Cancer Models: Melanoma Cell Line as a Case Study
- All Figures
- Figures for Letrado et al., 2021
|
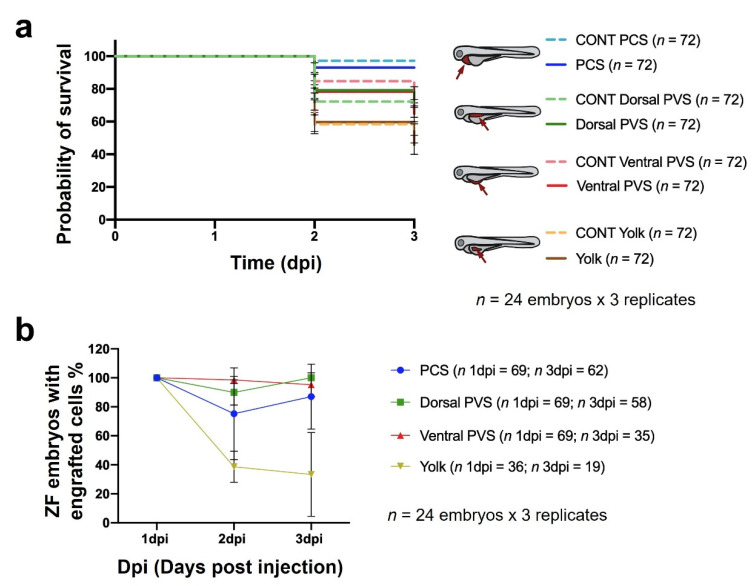
Figure 2 Impacts of different sites of cell implantation on embryo survival (a) and the percentage of zebrafish embryos containing engrafted 888mel mCherry cells. (b) Controls (CONT) refer to embryos microinjected with only the vehicle in which cells were diluted for microinjection (PBS + 2% PVP 60). The data are represented by Kaplan–Meier survival curves, and the results of statistical analyses for (a) are detailed in Table S5. Only zebrafish exhibiting a higher TA at 1 dpi than a pre-defined threshold were included in the analysis. Embryos were considered to present engrafted cells when the TA at 3 dpi was ≥ than the TA at 1 dpi. Results of the statistical analyses for (b) are shown in Tables S6.