
|
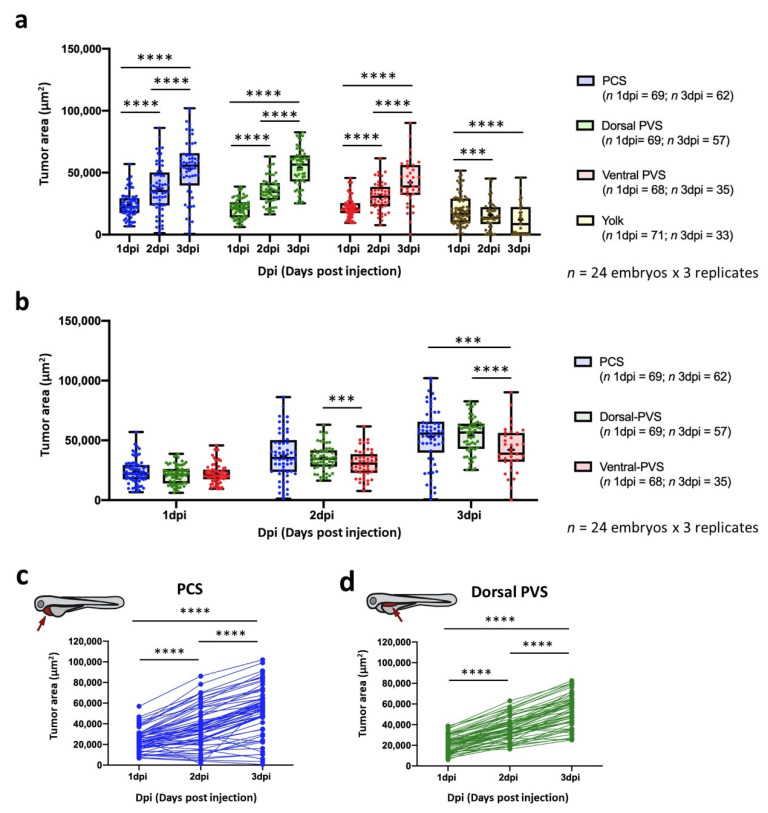
Figure 3 Impact of site of cell implantation on tumor area ascertained by imaging. (a) Comparison of the tumor areas of engrafted embryos at three time points grouped by the sites of injection. (b) Comparison of the tumor areas of engrafted embryos microinjected into different injection sites grouped by time points. Data are presented as box-leaf plots, where the box indicates IQR, line the median value and leafs the 5–95 percentile range. (c) Change in tumor area tracked for individual embryos implanted into the PCS and dorsal PVS. Only zebrafish possessing a tumor area higher than a pre-defined threshold were considered for the analysis (Table S2). Each dot represents an individual embryo. The experiment was designed as a balanced incomplete block assay. Mixed factorial ANOVA was performed with the anovalator STATA command (*** = p-value < 0.001; **** = p-value < 0.0001).