
- Title
-
A unique macrophage subpopulation signals directly to progenitor cells to promote regenerative neurogenesis in the zebrafish spinal cord
- Authors
- Cavone, L., McCann, T., Drake, L.K., Aguzzi, E.A., Oprişoreanu, A.M., Pedersen, E., Sandi, S., Selvarajah, J., Tsarouchas, T.M., Wehner, D., Keatinge, M., Mysiak, K.S., Henderson, B.E.P., Dobie, R., Henderson, N.C., Becker, T., Becker, C.G.
- Source
- Full text @ Dev. Cell
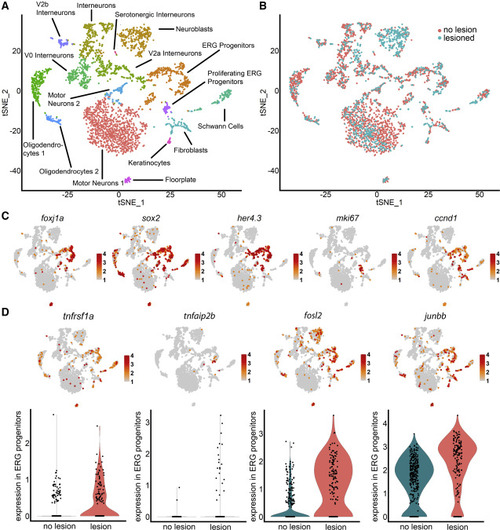
scRNA-seq indicates importance of TNF signaling in progenitor cells (A) Unsupervised clustering of her4.3:GFP+ cells identifies progenitor and other neural clusters. (B) Cells from lesioned and unlesioned samples contribute to cell clusters with a disproportionally high contribution of the lesioned sample to “neuroblasts.” (C) Marker gene distribution identifies proliferating ERG progenitor cell clusters. (D) TNF receptor (tnfrsf1a), downstream gene (tnfaip2b), and components of AP-1 signal transducing complex (fosl2, junbb) are enriched in ERG progenitor cells (tSNE plots), and expression is increased after injury (violin plots). For clarity, only cells with expression of > 2 are indicated in the feature plot of junbb. Color codes indicate expression levels from low (gray) to high (red) (see also Figure S1; Table S1). EXPRESSION / LABELING:
PHENOTYPE:
|
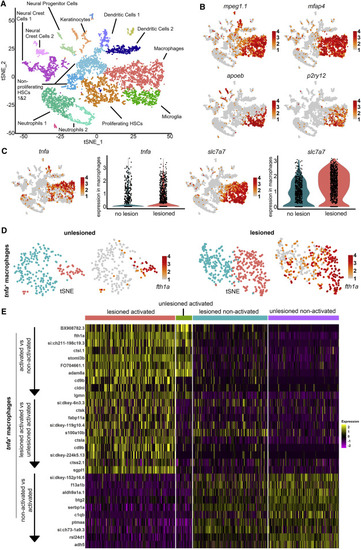
tnfa+ macrophages have a unique signature after injury (A) Unsupervised clustering of mpeg1:GFP+ cells at 1 dpl shows multiple clusters of cell identities. (B) Macrophages and microglia express mpeg1 and mfap4, but macrophages express lower levels of apoeb and p2ry12 than microglia. (C) tnfa is mainly expressed in macrophages. tnfa and slc7a7 are upregulated in macrophages after injury. (D) Unsupervised clustering of tnfa+ macrophages identifies two clusters in unlesioned and lesioned samples. Expression of fth1a identifies clusters of “activated macrophages.” For clarity, only cells with expression of > 1 are indicated in feature plot of fth1a. (E) Heatmaps of differentially expressed genes between tnfa+ macrophages. Top 10 genes shown for the indicated categories (see also Figure S1; Tables S1–S5). EXPRESSION / LABELING:
PHENOTYPE:
|
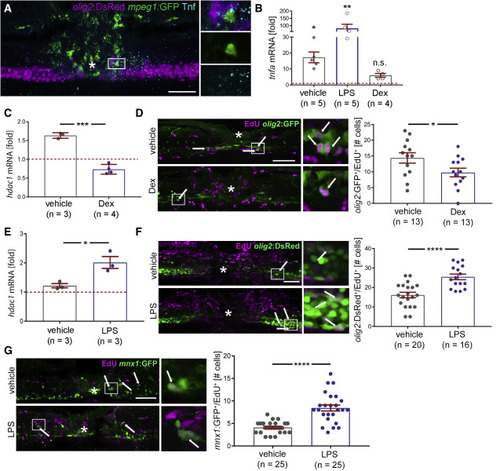
Tnf levels correlate with immune system-induced regenerative neurogenesis All photomicrographs are lateral views at 48 hpl (except A); asterisk indicates injury site; boxed areas are shown in higher magnification on the right. All qRT-PCR results are relative to unlesioned control, set to 1 and indicated by dashed red line; each dot represents one experiment. (A) Macrophages (mpeg1:GFP+) and Tnf protein are concentrated in the spinal injury site and close to (within 20 μm) motor neuron progenitor cells (olig2:DsRed+). A 4-dpf-larva is shown at 22 hpl (top: merge of all channels; middle: mpeg1:GFP; bottom: Tnf). See Figure S2A for separate channels and S2B for quantification. (B) qRT-PCR shows LPS increases and dexamethasone decreases tnfa expression (Incubation: −6 to 24 hpl for dexamethasone and 0 to 24 hpl for LPS; analysis at 24 hpl; Kruskal-Wallis test p = 0.0007; Dunn’s post-test: ∗p = 0.027; ∗∗∗p = 0.0003; n.s.: p = 0.687. (C) Dexamethasone decreases hdac1 mRNA expression after injury (incubation: −6 to 24 hpl; t test: ∗∗∗∗p = 0.0001). (D) Dexamethasone treatment reduces the number of proliferating motor neuron progenitor ERGs (olig2:GFP+/EdU+; incubation: dexamethasone: −6 to 48 hpl; EdU 0 to 48 hpl; t test: ∗p = 0.040). (E) LPS treatment increases hdac1 mRNA expression after injury (incubation: 0 to 24 hpl; t test: ∗p = 0.023). (F and G) LPS treatment increases the number of proliferating motor neuron progenitor ERGs (olig2:GFP+/EdU+) (F; t test, ∗∗∗∗p < 0.0001) and number of new motor neurons (G; mnx1:GFP+/EdU+; t test, ∗∗∗∗p < 0.0001); incubation: LPS: 0 to 48 hpl; EdU 0 to 48 hpl). Scale bars: 50 μm; 10 μm for insets. Data are represented as mean ± SEM (see also Figure S2; Tables S6–S8). |
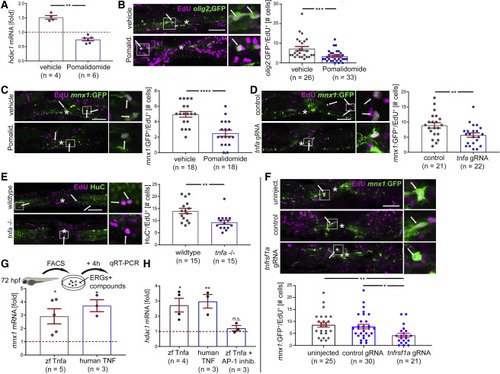
Tnf signaling promotes regenerative neurogenesis from progenitors Lateral views at 48 hpl are shown in photomicrographs; asterisks indicate the injury site; arrows indicate double-labeled cells; boxed areas are shown in higher magnification on the right. All qRT-PCR results are relative to unlesioned control, set to 1 and indicated by dashed red line; each dot represents one experiment. (A) Pomalidomide incubation reduces hdac1 mRNA levels in qRT-PCR of purified ERG progenitor cells (incubation: 0 to 24 hpl; Mann-Whitney U test: ∗∗p = 0.0095). (B and C) Pomalidomide treatment reduces the number of newly formed motor neuron progenitor cells (olig2:GFP+/EdU+; t test, ∗∗∗p = 0.0008; B) and motor neurons (mnx1:GFP+/EdU+; t test, ∗∗∗∗p < 0.0001; C) after spinal injury (incubation −2 to 48 hpl). (D) Acute tnfa gRNA perturbation reduces the number of newly formed motor neurons (mnx1:GFP+/EdU+) after spinal injury (EdU incubation 0 to 48 hpl; t test, ∗∗p = 0.0077). (E) Homozygous mutants for tnfa show reduced lesion-induced generation of neurons (HuC+/EdU+; EdU incubation: 0 to 48 hpl; t test, ∗∗p = 0.0026). (F) Acute injection of tnfrsf1a gRNA attenuates lesion-induced motor neuron (mnx1:GFP+/EdU+; ANOVA and Tukey’s post-test, ∗∗p = 0.0085, ∗p = 0.026) generation. (G and H) Ex vivo incubation of ERG progenitors with recombinant zebrafish (zf) Tnf-α and human TNF proteins for 4 h increases mnx1 mRNA expression levels, normalized to controls (G; Kruskall-Wallis test p = 0.0017; Dunn’s post-test ∗p = 0.0244 for zf Tnf-α, ∗p = 0.0160 for human Tnf). hdac1 mRNA expression (F) is also increased by both proteins compared with controls (one-way ANOVA p = 0.0029; Tukey’s post-test: ∗p = 0.0127; ∗∗p = 0.0085), but not in the presence of the AP-1 inhibitor S11302 (n.s. p = 0.9695). Scale bars, 50; 10 μm for insets. Data are represented as mean ± SEM. (see also Figure S3) EXPRESSION / LABELING:
PHENOTYPE:
|
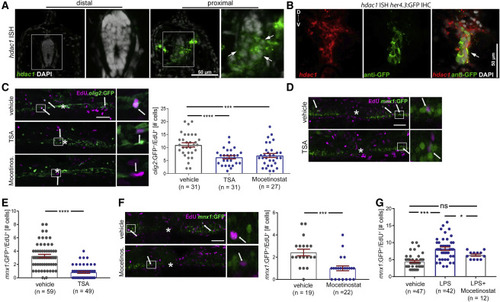
Hdac1 function is necessary for regenerative neurogenesis downstream of immune system activity Cross sections for (A and B) at 24 hpl; lateral views for (C, D, and F) at 48 hpl are shown; asterisks indicate the injury site; arrows indicate double-labeled cells; boxed areas are shown in higher magnification on the right. All incubations were from 0 to 48 hpl. (A and B) The fluorescent in situ hybridization (ISH) signal for hdac1 is stronger in the spinal cord proximal to the injury site than distal to it (arrows in A). Proximal to the injury site, the hdac1 ISH signal overlaps with GFP immunohistochemistry (IHC), detecting the her4.3:GFP transgene. (C) TSA and mocetinostat reduce the number of newly generated motor neuron progenitor ERGs (olig2:GFP+/EdU+); example images and quantification are shown (one-way ANOVA; p < 0.0001; Tukey’s post-test: ∗∗∗p = 0.0005; ∗∗∗∗p < 0.0001). (D and E) TSA reduces the number of newly generated motor neurons (mnx1:GFP+/EdU+) after spinal injury; example images in (D), quantification in (E) (t test ∗∗∗∗p < 0.0001). (F) Mocetinostat treatment reduces the number of newly generated motor neurons after injury (Mann-Whitney U test ∗∗∗p = 0.0002). (G) Mocetinostat co-application partially suppresses LPS-induced increase in motor neuron generation after injury (one-way ANOVA p < 0.0001; Holm-Sidak’s post-test ∗∗∗∗p < 0.0001; ∗p = 0.0463; ns, p = 0.0643). Scale bars: (A and B): 50 μm, inset 25 μm; (C, D, and F): 50 μm, insets: 10 μm. Data are represented as mean ± SEM (see also Figure S4). |
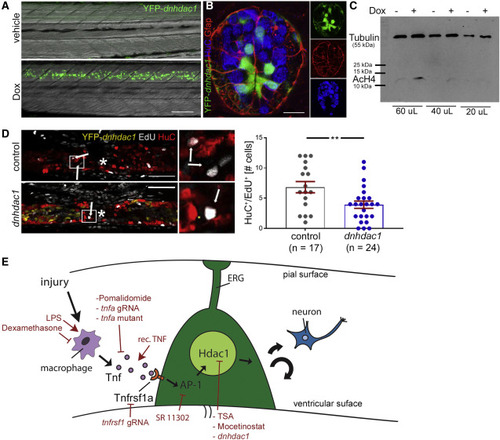
Hdac1 function in ERG progenitor cells is necessary for regenerative neurogenesis (A) Doxycycline (Dox) exposure leads to strong detectability of YFP in tg(her4.3:TetA; TetRE:YFP-dnhdac1) transgenic animals at 24 h post-induction; lateral views are shown (rostral left; dorsal up). (B) A cross section (dorsal up) through the spinal cord of a tg(her4.3:TetA; TetRE:YFP-dnhdac1) larva shows labeling in ventricular ERG progenitors, some of which are glial fibrillary acidic protein (Gfap) immune positive. Peripheral HuC immuno-labeled neurons are rarely labeled by the trasngene. (C) Western blot shows a doxycycline-induced increase in histone acetylation levels (AcH4) in FACS purified ERGs. Anti-tubulin labeling was used as a standard. (D) Activation of transgene expression reduces the number of newly generated neurons (HuC+/EdU+, t test: ∗∗p = 0.009; incubation time for doxycycline and EdU: 0 to 48 hpl). Control is doxycycline-treated non-transgenic siblings. (E) Graphical summary of immune system mediated regenerative neurogenesis with experimental interventions indicated in red. Scale bars: 50 μm. Data are represented as mean ± SEM. |
Reprinted from Developmental Cell, 56(11), Cavone, L., McCann, T., Drake, L.K., Aguzzi, E.A., Oprişoreanu, A.M., Pedersen, E., Sandi, S., Selvarajah, J., Tsarouchas, T.M., Wehner, D., Keatinge, M., Mysiak, K.S., Henderson, B.E.P., Dobie, R., Henderson, N.C., Becker, T., Becker, C.G., A unique macrophage subpopulation signals directly to progenitor cells to promote regenerative neurogenesis in the zebrafish spinal cord, 1617-1630.e6, Copyright (2021) with permission from Elsevier. Full text @ Dev. Cell