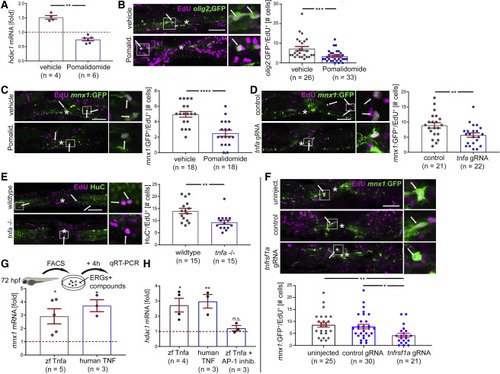
Tnf signaling promotes regenerative neurogenesis from progenitors Lateral views at 48 hpl are shown in photomicrographs; asterisks indicate the injury site; arrows indicate double-labeled cells; boxed areas are shown in higher magnification on the right. All qRT-PCR results are relative to unlesioned control, set to 1 and indicated by dashed red line; each dot represents one experiment. (A) Pomalidomide incubation reduces hdac1 mRNA levels in qRT-PCR of purified ERG progenitor cells (incubation: 0 to 24 hpl; Mann-Whitney U test: ∗∗p = 0.0095). (B and C) Pomalidomide treatment reduces the number of newly formed motor neuron progenitor cells (olig2:GFP+/EdU+; t test, ∗∗∗p = 0.0008; B) and motor neurons (mnx1:GFP+/EdU+; t test, ∗∗∗∗p < 0.0001; C) after spinal injury (incubation −2 to 48 hpl). (D) Acute tnfa gRNA perturbation reduces the number of newly formed motor neurons (mnx1:GFP+/EdU+) after spinal injury (EdU incubation 0 to 48 hpl; t test, ∗∗p = 0.0077). (E) Homozygous mutants for tnfa show reduced lesion-induced generation of neurons (HuC+/EdU+; EdU incubation: 0 to 48 hpl; t test, ∗∗p = 0.0026). (F) Acute injection of tnfrsf1a gRNA attenuates lesion-induced motor neuron (mnx1:GFP+/EdU+; ANOVA and Tukey’s post-test, ∗∗p = 0.0085, ∗p = 0.026) generation. (G and H) Ex vivo incubation of ERG progenitors with recombinant zebrafish (zf) Tnf-α and human TNF proteins for 4 h increases mnx1 mRNA expression levels, normalized to controls (G; Kruskall-Wallis test p = 0.0017; Dunn’s post-test ∗p = 0.0244 for zf Tnf-α, ∗p = 0.0160 for human Tnf). hdac1 mRNA expression (F) is also increased by both proteins compared with controls (one-way ANOVA p = 0.0029; Tukey’s post-test: ∗p = 0.0127; ∗∗p = 0.0085), but not in the presence of the AP-1 inhibitor S11302 (n.s. p = 0.9695). Scale bars, 50; 10 μm for insets. Data are represented as mean ± SEM. (see also Figure S3)
|
