
- Title
-
Bi-allelic VPS16 variants limit HOPS/CORVET levels and cause a mucopolysaccharidosis-like disease
- Authors
- Sofou, K., Meier, K., Sanderson, L.E., Kaminski, D., Montoliu-Gaya, L., Samuelsson, E., Blomqvist, M., Agholme, L., Gärtner, J., Mühlhausen, C., Darin, N., Barakat, T.S., Schlotawa, L., van Ham, T., Asin Cayuela, J., Sterky, F.H.
- Source
- Full text @ EMBO Mol. Med.
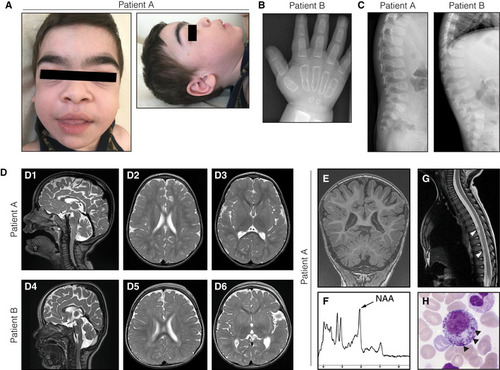
Facial phenotypes of patient A at 3.5 years of age, showing coarse facial features, broad ear lobes, macroglossia, and hypertrichosis. Radiograph of the hand of patient B at 21 months of age demonstrating rough trabecular structure and thin corticalis as signs of dysostosis multiplex. Ovoid vertebrae visualized by spine radiographs of both patients. T2‐weighed brain MRIs of patient A (D1–3) at 28 months of age and patient B at (D4–6) at 16 months of age, showing global brain atrophy as well as periventricular and deep white matter hyperintensities. Additional MR investigations of patient A at 28 months of age. (E) T1‐weighed coronal images demonstrating thinning of the posterior corpus callosum and reduced volumes of the cerebellar hemispheres and vermis. (F) Magnetic resonance spectroscopy of the white matter showing a decreased May Grunwald‐Giemsa‐stained bone marrow smear from patient A with myelopoietic cells containing dense granules (arrowheads), suggestive of a lysosomal storage disorder. |
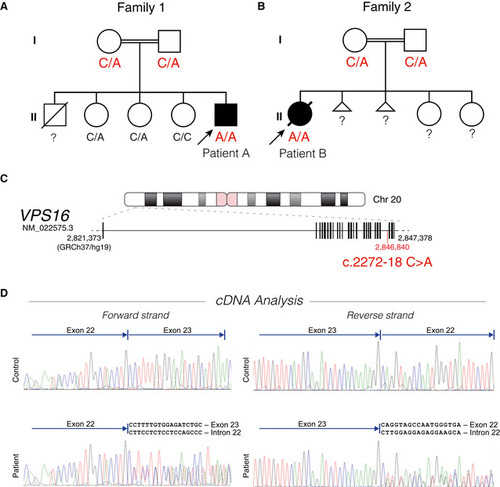
Pedigrees of the two families, indicating autosomal recessive inheritance. The genotype of the Position of the intronic c.2272‐18 variant in the VPS16 gene. cDNA analysis by Sanger sequencing of leukocyte RNA from patient A and a control sample. Reads beyond the alternatively spliced breakpoint yield double reads in patient samples, corresponding to the predicted mis‐splicing and wild‐type sequences. |
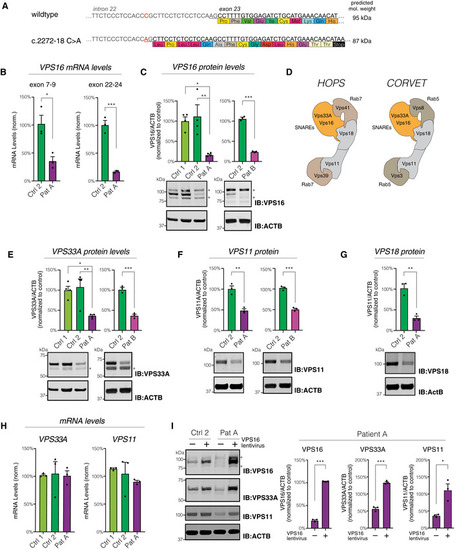
The c.2272‐18C>A variant generates a new splice‐acceptor sequence 16 base pairs upstream of the normal exon 23 border, resulting in a frameshift and premature stop codon. Levels of Quantifications of VPS16 in fibroblast lysates by immunoblotting. Representative immunoblots (bottom) and summary quantifications (top) of the levels of VPS16 in patient A ( Schematic illustration of HOPS and CORVET complexes showing their subunit compositions. The Rab5‐binding CORVET subunits VPS3 and VPS8 replace the Rab7‐binding VPS39 and VPS41 of HOPS. Models adapted from Bröcker et al ( Quantifications of HOPS/CORVET subunits in fibroblast lysates (top) and representative immunoblots (bottom), analyzed as in (C). (E) VPS33A, (F) VPS11, (G) VPS18. Analysis of Immunoblots (left) and quantifications normalized to control (right) of VPS16, VPS33A, and VPS11 in lysates from fibroblasts transduced with a lentivirus to express Data information: All immunoblots were acquired using fluorescent secondaries and pseudocolored to greyscale. Stars denote unspecific bands. All data were shown as mean ±SEM of 3–4 biological replicates. Statistical comparisons were made by two‐tailed unpaired Student’s |
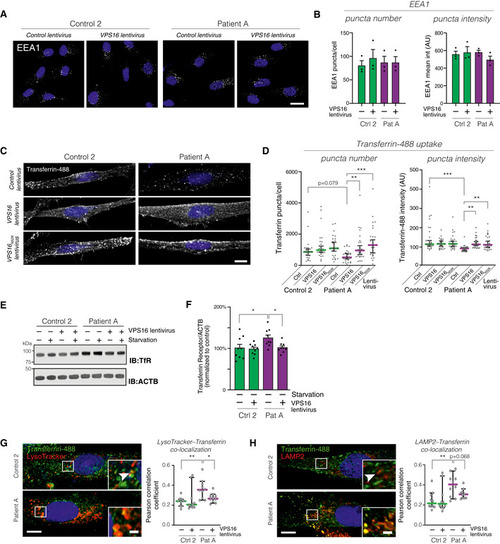
Analysis of the early endosome marker EEA1 in fibroblasts transduced with control or Analysis of transferrin uptake in fibroblasts transduced with the indicated lentiviruses. Representative confocal micrographs of fibroblasts fed with Alexa488‐conjugated Transferrin for 30 min. Scale bar, 10 μm. Quantifications of the number and fluorescence intensities of intracellular Transferrin puncta ( Immunoblot for Transferrin receptor (TfR) levels in the indicated fibroblasts under basal and serum‐starved conditions. Summary quantification of Transferrin receptor levels in non‐starved fibroblasts transduced with the indicated lentiviruses, normalized to actin (ACTB), and expressed as % of controls ( Analysis of intracellular Transferrin trafficking. Fibroblasts fed with fluorescently labeled Transferrin were co‐stained with LysoTracker (G) or an antibody against LAMP2 (H). Representative images (left) of fibroblasts transduced with control virus, with magnified areas demonstrating co‐localized puncta (arrowheads). Scale bars 10 μm or 2 μm (inserts). Quantifications (right) of the co‐localization between Transferrin and LysoTracker or LAMP2, respectively, expressed as Pearson correlation coefficients. Colored horizontal bars indicate the median values and whiskers 5 and 95 percentiles ( Data information: Bar graphs represent data as mean ±SEM. Statistical comparisons between the indicated groups by one‐way ANOVA with Holm–Sidak’s multiple comparisons tests. * |
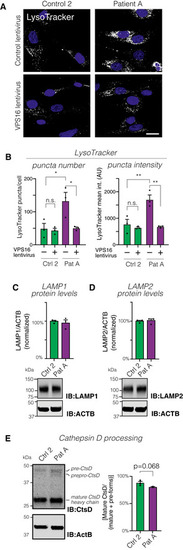
Confocal micrographs of fibroblasts transduced with control or Quantification of LysoTracker‐stained puncta number and intensities (ca 80 cells analyzed for each of Representative immunoblots (bottom) and summary quantifications (top) of the levels of LAMP1 (C) and LAMP2 (D) in fibroblasts, normalized to levels of actin (ACTB) and expressed as % of controls ( Analysis of lysosomal Cathepsin D (CtsD) processing by immunoblotting. Immunoblot to detect CtsD isoforms (left) and quantification (right) of processing, calculated as the percentage of CtsD divided by the sum of all isoforms ( Data information: Bar graphs represent data as mean ±SEM. Statistical comparisons between the indicated groups by two‐tailed unpaired Student’s |
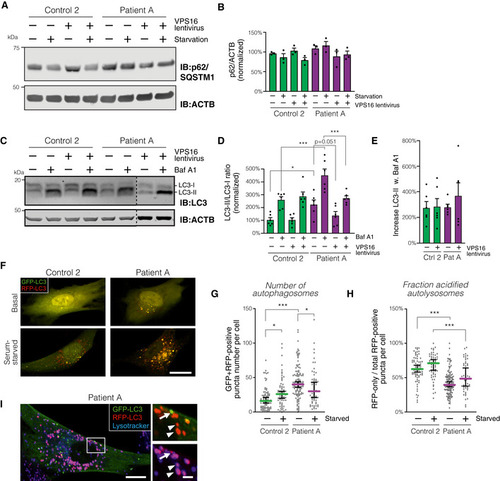
Analysis of p62/SQSTM1 levels in patient and control fibroblasts transduced with control or Summary quantification of (A), normalized to actin (ACTB) and expressed as % of controls ( Analysis of LC3 isoforms in serum‐starved fibroblasts transduced with control or Quantification of LC3‐II, normalized to levels of LC3‐I, actin and expressed as % of controls ( Autophagic flux, calculated as the relative increase in LC3‐II ratios upon addition of Baf A1 (data from D; Analysis of autophagosome numbers in fibroblasts transfected to express mRFP‐GFP‐LC3. (F) Representative confocal micrographs (optical sections) of fibroblasts imaged live under basal or serum‐starved conditions. Scale bar, 20 μm. (G and H) Quantification of autophagosomes, defined as green + red puncta (G) and autophago‐lysosomes, calculated as the number of red (but not green) puncta divided by the total number of puncta. Colored horizontal bars denote median values and whiskers 5 and 95 percentiles ( Data information: Bar graphs represent data as mean ±SEM. Statistical comparisons between the indicated groups by one‐way ANOVA with Holm–Sidak’s multiple comparisons tests. * |
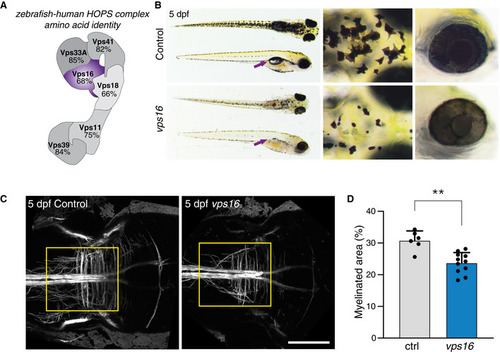
Schematic representation of the HOPS complex, indicating the high amino acid identity between human and zebrafish for each subunit. Comparison of control and Myelination, as reported using the |
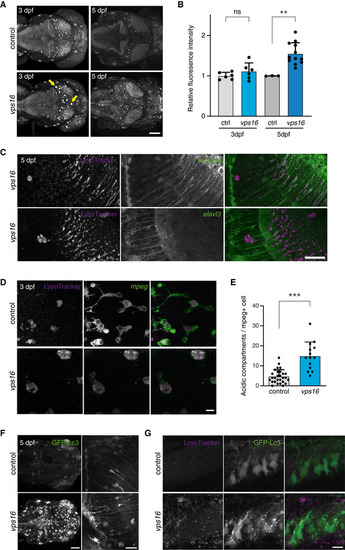
LysoTracker‐stained acidic compartments in zebrafish larvae brains at 3 and 5 dpf. Total signal was increased across the brains of LysoTracker signal colocalizes with the astroglial reporter The puncta indicated in A exist within cells expressing the Microglia at 3 dpf contain an increased number of acidic compartments as compared with controls. Global GFP‐Lc3 signal is increased in unstimulated Magnified view of the anterior hindbrain showing numerous GFP‐Lc3 puncta in the Data information: Scale bars 100 μm in (A, F left), 30 μm in (C), 20 μm in (F right), and 10 μm in (D, G). Bar graphs represent data as mean ±SEM. Statistical comparisons by Mann–Whitney EXPRESSION / LABELING:
PHENOTYPE:
|
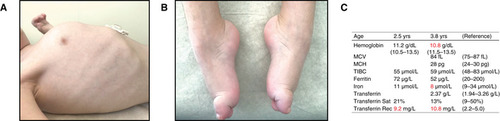
Photographs at 3.5 years of age. (A) Barrel‐shaped chest with pectus carinatum. (B) Pes cavus with hammertoe deformity of first toes bilaterally. Blood and plasma iron status at indicated ages. The patient received oral iron supplementation. Values outside reference range are colored red. MCV, mean corpuscular volume; MCH, mean corpuscular hemoglobin; TIBC, total iron‐binding capacity. |
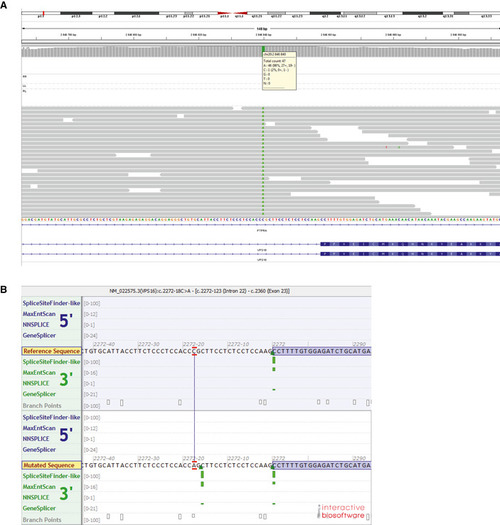
Assembly of whole‐genome sequencing reads, identifying the VPS16 c.2272‐18 variant (in patient A). Predicted impact by the c.2272‐18C>A variant on splicing, as predicted by algorithms used by Alamut Visual (Interactive Biosoftware). Green bars indicate predicted splice‐acceptor sites. |
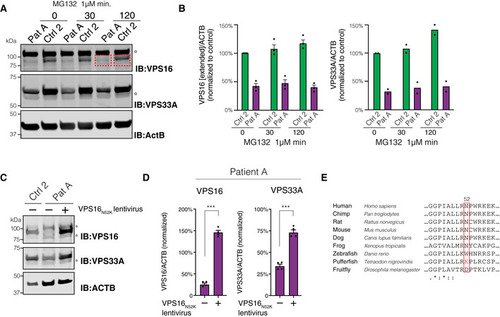
Effect of proteasome inhibition on VPS16 and VPS33A. (A) Immunoblots for VPS16 and VPS33A and quantifications of protein levels in lysates of fibroblasts treated with MG132 for 30 or 120 min, respectively. VPS16 band densities were quantified in an extended area (indicated by red boxes) to capture the presence of a possible truncated protein with a molecular weight of 87 kDa (wild‐type VPS16 is 95 kDa). Stars denote unspecific bands. (B) Quantifications of (A) normalized to control conditions and represented as mean ± SEM for VPS16 ( Rescue of cellular phenotype by VPSN52K. (C) Representative immunoblots of fibroblast lysates using antibodies against VPS16, VPS33A, and actin. Stars denote unspecific bands. (D) Levels of VPS16 and VPS33A quantified in patient cells transduced with control or VPS16N52K‐expressing lentiviruses and normalized to levels of actin ( |
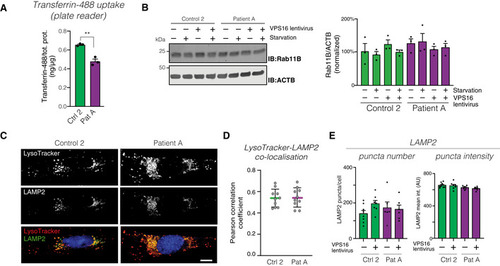
Quantification of cellular uptake of fluorescently labeled transferrin in fibroblast lysates, normalized to total protein levels ( Immunoblot (left) of RAB11B in the indicated fibroblasts, under basal and serum‐starved conditions, and (right) summary quantifications normalized to levels of actin (ACTB) and expressed as % of controls. Bar graphs represent data as mean ±SEM ( Representative confocal micrographs of fibroblasts stained for LAMP2 and LysoTracker. Scale bar 10 μm. Quantification of the co‐localization between LysoTracker and LAMP2, expressed as Pearson correlation coefficients. Colored horizontal bars indicate the median values and whiskers 5 and 95 percentiles ( Quantification of the number and intensities of LAMP2‐stained puncta. Data represented as mean ± SEM ( |
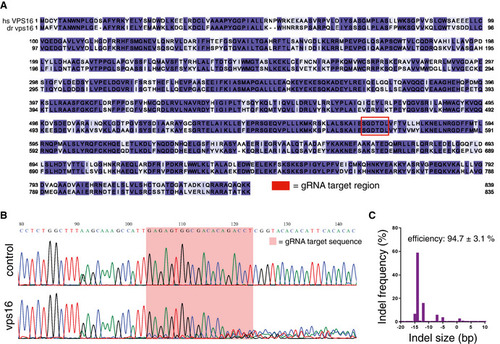
Amino acid sequence alignment of the human and zebrafish VPS16 proteins, colored according to homology and with the region of the gRNA target site indicated. Representative sequence trace for a zebrafish Representative indel distribution for a sequenced |