
Figure EV4
- ID
- ZDB-FIG-210512-54
- Publication
- Sofou et al., 2021 - Bi-allelic VPS16 variants limit HOPS/CORVET levels and cause a mucopolysaccharidosis-like disease
- Other Figures
- All Figure Page
- Back to All Figure Page
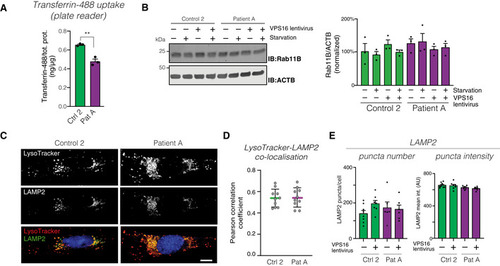
Quantification of cellular uptake of fluorescently labeled transferrin in fibroblast lysates, normalized to total protein levels ( Immunoblot (left) of RAB11B in the indicated fibroblasts, under basal and serum‐starved conditions, and (right) summary quantifications normalized to levels of actin (ACTB) and expressed as % of controls. Bar graphs represent data as mean ±SEM ( Representative confocal micrographs of fibroblasts stained for LAMP2 and LysoTracker. Scale bar 10 μm. Quantification of the co‐localization between LysoTracker and LAMP2, expressed as Pearson correlation coefficients. Colored horizontal bars indicate the median values and whiskers 5 and 95 percentiles ( Quantification of the number and intensities of LAMP2‐stained puncta. Data represented as mean ± SEM ( |