
Figure 5
- ID
- ZDB-FIG-210512-55
- Publication
- Sofou et al., 2021 - Bi-allelic VPS16 variants limit HOPS/CORVET levels and cause a mucopolysaccharidosis-like disease
- Other Figures
- All Figure Page
- Back to All Figure Page
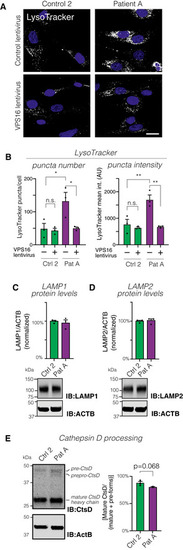
Confocal micrographs of fibroblasts transduced with control or Quantification of LysoTracker‐stained puncta number and intensities (ca 80 cells analyzed for each of Representative immunoblots (bottom) and summary quantifications (top) of the levels of LAMP1 (C) and LAMP2 (D) in fibroblasts, normalized to levels of actin (ACTB) and expressed as % of controls ( Analysis of lysosomal Cathepsin D (CtsD) processing by immunoblotting. Immunoblot to detect CtsD isoforms (left) and quantification (right) of processing, calculated as the percentage of CtsD divided by the sum of all isoforms ( Data information: Bar graphs represent data as mean ±SEM. Statistical comparisons between the indicated groups by two‐tailed unpaired Student’s |